A financial forecast estimates where a SaaS company could be heading based on a set of assumptions.
Scenario planning asks a different question:
What could happen if those assumptions change?
Instead of relying on a single forecast, SaaS founders can model multiple scenarios based on different assumptions for subscriber growth, churn, expansion, pricing, hiring, spending, and other business drivers.
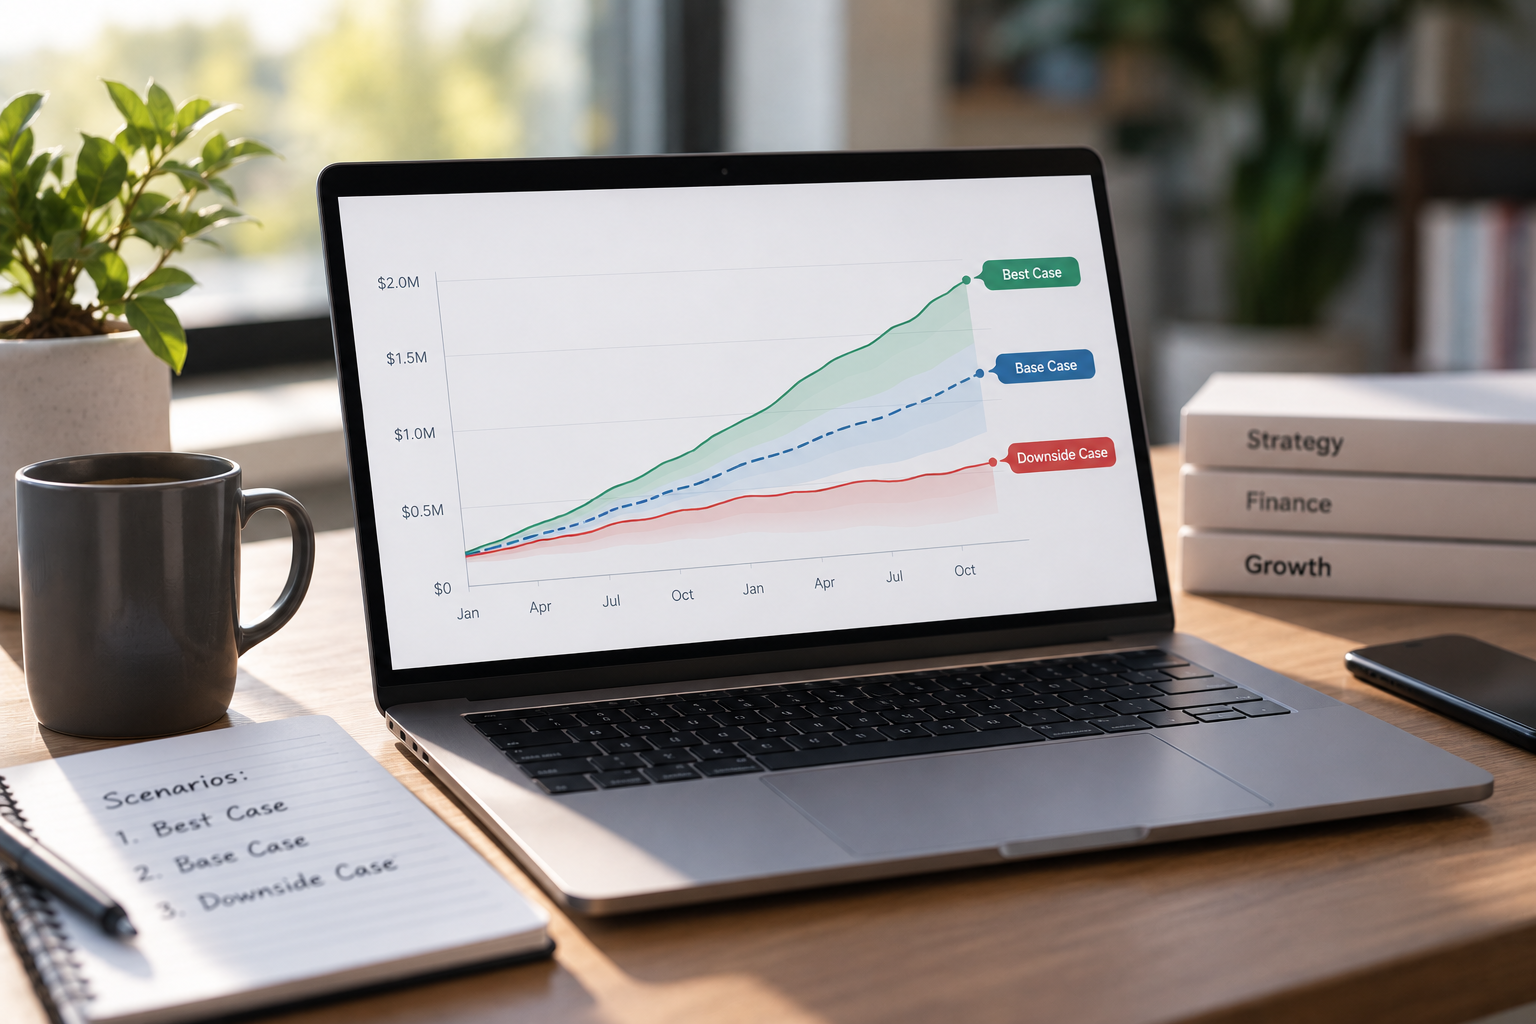
A base-case scenario can represent the expected or baseline financial outlook. A best-case scenario can model stronger performance. A downside scenario can show what could happen if growth slows, churn increases, expenses rise, or other conditions deteriorate.
By combining Stripe subscription data with QuickBooks financial data, SaaS founders can model how changes in operating assumptions could flow through MRR, revenue, expenses, profitability, cash flow, and runway.
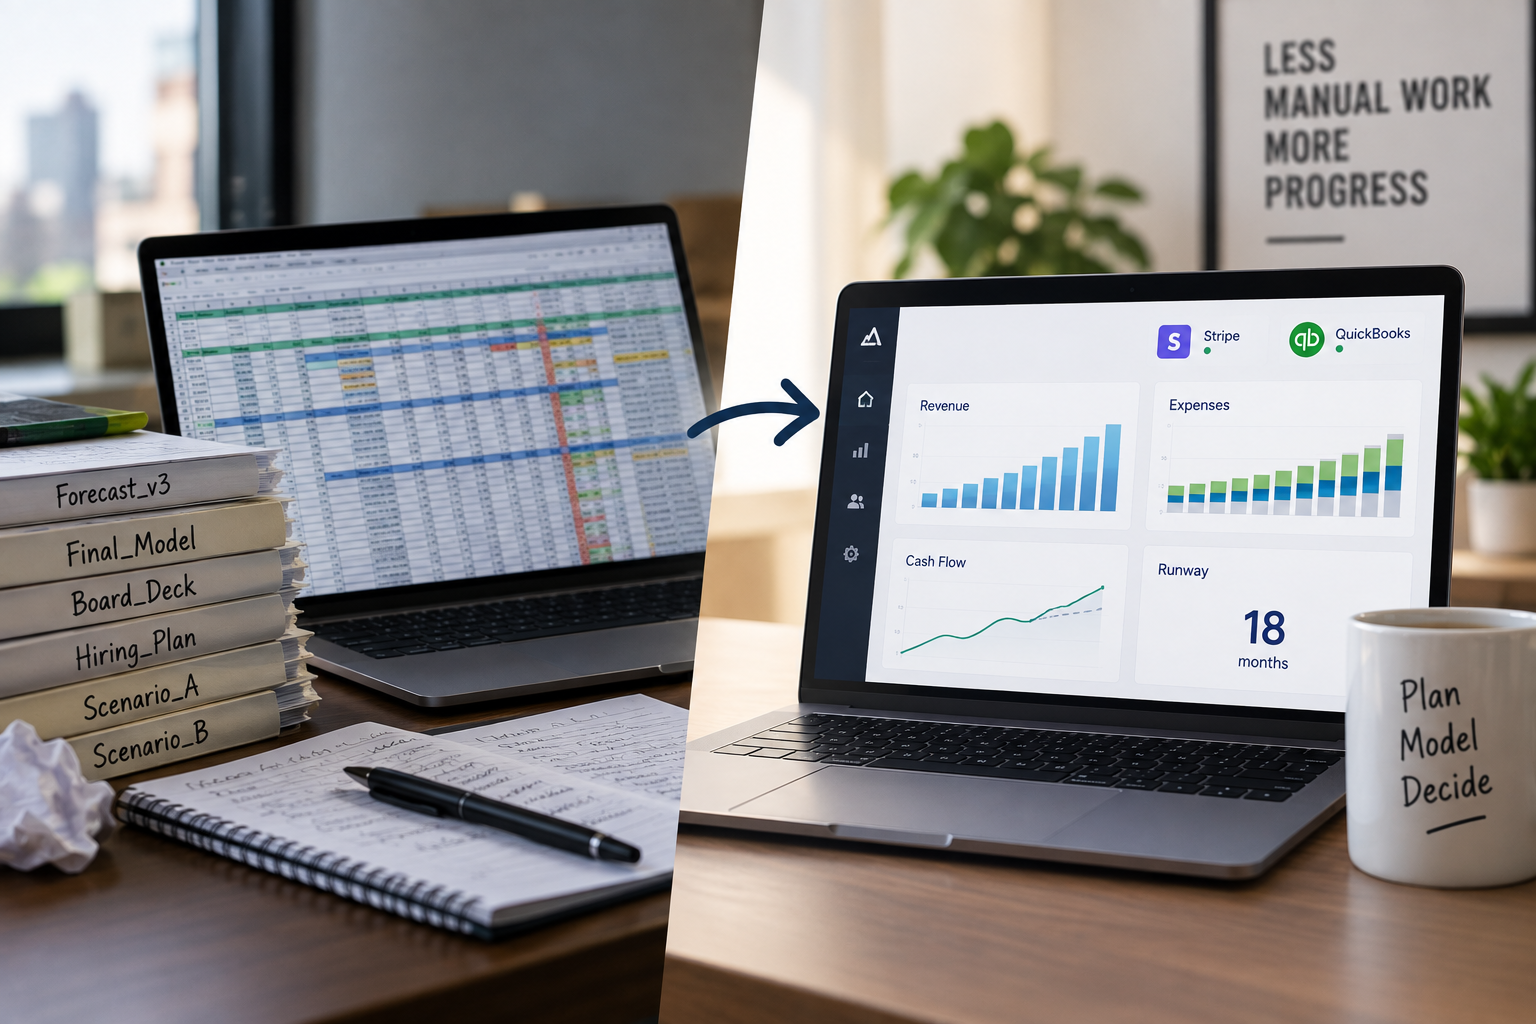
RunSmart by Projection Genie automatically establishes a financial baseline from historical data and allows founders to model alternative scenarios without having to build and maintain separate financial models manually.
What Is SaaS Scenario Planning?
SaaS scenario planning is the process of modeling multiple possible financial futures based on different assumptions about how the business could perform.
Rather than asking:
What will happen?
scenario planning asks:
What could happen under different conditions?
A SaaS company might model:
- Base-case growth
- Faster subscriber growth
- Slower subscriber growth
- Higher churn
- Lower churn
- More expansion revenue
- Pricing changes
- Additional hiring
- Reduced hiring
- Higher marketing spending
- Lower operating expenses
- New financing
Each scenario produces a different financial outlook.
What Is the Difference Between a Forecast and a Scenario?
A forecast estimates future financial performance using historical data, assumptions, or both.
A scenario changes one or more assumptions to evaluate an alternative possible outcome.
For example, a baseline forecast may project:
- 4% monthly subscriber growth
- 2% monthly customer churn
- Current pricing
- Existing hiring plans
- Current spending patterns
A scenario could change churn from 2% to 4% while leaving the other assumptions unchanged.
The resulting financial forecast would show how higher churn could affect future MRR, revenue, profitability, cash flow, and runway.
What Are Best-Case, Base-Case, and Downside SaaS Scenarios?
These scenarios represent different sets of assumptions about future business performance.
A base case generally represents the company's expected or baseline outlook.
A best case models stronger operating or financial performance.
A downside case models weaker performance or greater financial pressure.
The assumptions should reflect the company's actual business rather than arbitrary percentages.
How Do You Build a Base-Case SaaS Scenario?
A base case can begin with the company's historical performance.
Relevant Stripe data may include:
- Subscriber growth
- Customer churn
- Revenue churn
- MRR growth
- Expansion
- Contraction
- Pricing
- ARPA
- NRR
Relevant QuickBooks data may include:
- Revenue
- Payroll
- Marketing expenses
- Software expenses
- Hosting expenses
- Other operating expenses
- Debt
- Cash balances
- Cash flow
Historical patterns can be used to establish a baseline forecast.
The founder can then evaluate alternative scenarios relative to that baseline.
Why Is a Data-Driven Baseline Important?
Scenario planning becomes less useful when every assumption must be created manually from scratch.
A data-driven baseline provides a starting point based on how the business has actually performed.
For example, if historical data indicates:
- Subscriber growth averaging 4%
- Customer churn averaging 2%
- Expansion MRR averaging 1.5%
- Payroll growing gradually
- Marketing expenses remaining relatively stable
those patterns can form the starting point for the forecast.
The founder can then ask what happens if one or more of those patterns change.
How Do You Build a Best-Case SaaS Scenario?
A best-case scenario models stronger business performance than the baseline.
Possible assumptions could include:
- Faster subscriber growth
- Lower churn
- Higher expansion revenue
- Less contraction
- Successful pricing changes
- Higher retention
- Better operating leverage
Suppose the base case assumes:
Monthly subscriber growth = 4%
Monthly customer churn = 2%
The best case might assume:
Monthly subscriber growth = 6%
Monthly customer churn = 1.5%
The forecast can then show how those changes compound over time.
How Do You Build a Downside SaaS Scenario?
A downside scenario models weaker business performance or increased financial pressure.
Possible assumptions include:
- Slower customer acquisition
- Higher churn
- Lower expansion
- More contraction
- Pricing pressure
- Higher payroll costs
- Increased marketing spending
- Delayed financing
For example:
Base-case monthly subscriber growth = 4%
Downside monthly subscriber growth = 2%
and:
Base-case customer churn = 2%
Downside customer churn = 4%
The resulting scenario may produce significantly lower MRR over time.
If operating expenses remain unchanged, the downside scenario could also produce higher cash burn and shorter runway.
What SaaS Variables Should Be Included in Scenario Planning?
Scenario planning can include both SaaS operating metrics and broader financial assumptions.
The most useful scenarios usually focus on variables that materially affect the company's financial outlook.
How Do Subscriber Growth and Churn Work Together in a Scenario?
Subscriber growth and churn should not be modeled independently when forecasting customer count.
A simplified formula is:
Ending Subscribers = Beginning Subscribers + New Subscribers - Churned Subscribers
Suppose a company begins with:
1,000 subscribers
Base Case
New subscribers:
50
Churned subscribers:
20
Ending subscribers:
1,000 + 50 - 20 = 1,030
Downside Case
New subscribers:
30
Churned subscribers:
40
Ending subscribers:
1,000 + 30 - 40 = 990
The base case grows by 30 subscribers.
The downside case loses 10.
Repeated over many months, these differences can compound substantially.
How Do You Model MRR Under Different SaaS Scenarios?
A useful MRR framework is:
Ending MRR = Beginning MRR + New MRR + Expansion MRR - Contraction MRR - Churned MRR
Suppose beginning MRR is:
$100,000
Base Case
- New MRR: $8,000
- Expansion MRR: $3,000
- Contraction MRR: $1,000
- Churned MRR: $4,000
Ending MRR:
$100,000 + $8,000 + $3,000 - $1,000 - $4,000 = $106,000
Best Case
- New MRR: $12,000
- Expansion MRR: $5,000
- Contraction MRR: $500
- Churned MRR: $2,500
Ending MRR:
$114,000
Downside Case
- New MRR: $5,000
- Expansion MRR: $2,000
- Contraction MRR: $2,000
- Churned MRR: $7,000
Ending MRR:
$98,000
One month already produces materially different outcomes.
Over a 12-month forecast, the differences can become much larger.
Why Should SaaS Scenarios Extend Beyond MRR?
MRR tells only part of the story.
Suppose the best-case scenario produces significantly higher MRR.
If achieving that growth also requires:
- More salespeople
- Higher marketing spending
- Additional engineers
- More infrastructure
- Additional customer support
expenses may increase as well.
The best revenue scenario is not necessarily the best cash flow scenario.
That is why SaaS scenario planning should connect operating assumptions to the full financial forecast.
How Does Hiring Change a SaaS Scenario?
Hiring adds recurring expenses and can materially change profitability, cash flow, and runway.
Suppose a company is considering five hires with an average total monthly cost of:
$12,000 per employee
Total additional monthly workforce cost:
5 × $12,000 = $60,000
A scenario can model those hires alongside projected subscriber growth.
For example:
- Scenario A: No additional hiring
- Scenario B: Hire five employees immediately
- Scenario C: Hire five employees six months from now
- Scenario D: Hire only if subscriber growth exceeds expectations
The resulting financial forecasts can show how the timing and size of the hiring plan affect future cash.
How Does Pricing Change a SaaS Scenario?
Pricing changes can affect:
- MRR
- ARR
- Customer churn
- Subscriber growth
- Expansion
- Contraction
- Profitability
- Cash flow
A founder could model:
Scenario A: Current pricing
Scenario B: 10% price increase with unchanged churn
Scenario C: 10% price increase with higher churn
Scenario D: Higher prices for new customers only
Comparing these scenarios provides more information than simply calculating the immediate revenue increase from a higher price.
How Does Churn Affect SaaS Scenario Planning?
Churn is especially important because its effects compound.
Consider 1,000 customers with no new customer acquisition for simplicity.
At 2% monthly churn:
Month 1 customers = 1,000 × 98% = 980
At 5% monthly churn:
Month 1 customers = 1,000 × 95% = 950
If those churn rates continue, the difference becomes progressively larger.
That affects future:
- Subscriber count
- MRR
- ARR
- Revenue
- Cash flow
- Runway
Testing multiple churn assumptions helps founders understand how sensitive the financial forecast is to retention.
What Is SaaS Sensitivity Analysis?
Sensitivity analysis tests how changing a specific assumption affects the financial forecast.
For example, a founder could hold all other assumptions constant and test customer churn at:
- 1%
- 2%
- 3%
- 4%
- 5%
The resulting forecasts show how sensitive future MRR, cash flow, or runway is to churn.
Scenario planning can change multiple assumptions at once.
Sensitivity analysis is often used to isolate the effect of a particular variable.
What Is the Difference Between Scenario Planning and Sensitivity Analysis?
Scenario planning typically combines multiple assumptions to represent a coherent possible future.
Sensitivity analysis changes one or a limited number of variables to understand their individual financial impact.
Both approaches can be useful.
How Does SaaS Scenario Planning Affect Cash Flow?
Changes to revenue and expenses eventually affect cash flow.
A simplified formula is:
Net Cash Flow = Cash Inflows - Cash Outflows
Suppose the company has:
$500,000 beginning cash
Base Case
Monthly cash inflows:
$150,000
Monthly cash outflows:
$170,000
Monthly burn:
$20,000
Downside Case
Monthly cash inflows decline to:
$125,000
while cash outflows remain:
$170,000
Monthly burn becomes:
$45,000
The downside scenario consumes cash more than twice as quickly.
How Does Scenario Planning Affect SaaS Runway?
Because each scenario can produce a different cash burn profile, each can also produce a different runway.
A simplified runway formula is:
Runway = Available Cash ÷ Monthly Net Cash Burn
With $600,000 cash:
At $20,000 monthly burn:
30 months
At $40,000 monthly burn:
15 months
At $60,000 monthly burn:
10 months
In practice, SaaS runway should be forecast dynamically because revenue and expenses can change each month.
Scenario planning allows those future changes to be incorporated rather than assuming a constant burn rate.
Can a Best-Case Revenue Scenario Produce Worse Cash Flow?
Yes.
Suppose faster growth requires aggressive hiring and marketing.
Scenario A might produce:
- $2 million ending ARR
- $20,000 monthly cash burn
Scenario B might produce:
- $3 million ending ARR
- $80,000 monthly cash burn
Scenario B produces more ARR but consumes substantially more cash.
Whether that tradeoff makes sense depends on the company's objectives, capital position, growth strategy, and other factors.
This demonstrates why scenario planning should evaluate financial outcomes beyond revenue growth.
What Financial Outcomes Should SaaS Scenarios Compare?
Founders should compare the same financial and operating outcomes across scenarios.
Consistent comparisons make it easier to understand the tradeoffs created by each set of assumptions.
Example: Best-Case, Base-Case, and Downside SaaS Scenarios
Consider a SaaS company with:
- 1,000 subscribers
- $100 average MRR per subscriber
- $100,000 current MRR
- $750,000 cash
- Existing operating expenses
The founder creates three scenarios.
Best Case
- Faster subscriber growth
- Lower churn
- Higher expansion
- Current hiring plan
Base Case
- Historical subscriber growth continues
- Historical churn continues
- Current expansion patterns continue
- Current hiring plan
Downside Case
- Slower subscriber growth
- Higher churn
- Lower expansion
- Current hiring plan continues
The resulting forecasts might look conceptually like this:
These numbers are illustrative.
The important point is that the same company can have dramatically different financial outcomes depending on how the operating assumptions change.
Should a SaaS Downside Scenario Assume Everything Goes Wrong?
Not necessarily.
A useful downside scenario should be plausible.
If every assumption is made unrealistically negative, the scenario may provide little practical value.
A downside case might instead reflect:
- Churn returning to a previous high
- Subscriber growth slowing
- A planned hire occurring before growth materializes
- Marketing costs increasing
- Financing arriving later than expected
The objective is to model a credible weaker outcome that helps the founder understand financial exposure.
Should a Best-Case Scenario Be Extremely Optimistic?
The same principle applies.
A best-case scenario should generally represent plausible stronger performance rather than an arbitrary hockey-stick forecast.
Historical performance, current pipeline, retention trends, expansion behavior, pricing plans, and operational capacity can provide context for stronger assumptions.
How Often Should SaaS Scenarios Be Updated?
Scenarios should be revisited as actual business performance changes.
For example, if:
- Churn increases
- Subscriber growth accelerates
- Pricing changes
- Hiring plans change
- Expenses increase
- Financing occurs
the underlying financial outlook may also change.
Updating the baseline with recent actual data provides a new reference point for future scenarios.
Why Should Scenarios Start With Historical Data?
Historical data provides context for whether an assumption represents a small adjustment or a major departure from past performance.
For example:
If historical churn has consistently ranged between 2% and 3%, modeling 2%, 3%, and 4% may provide useful sensitivity analysis.
Jumping immediately to 15% churn may be less useful unless the company has a reason to believe such an outcome is plausible.
Historical data does not determine the future, but it provides an evidence-based starting point.
How Do Stripe and QuickBooks Work Together for SaaS Scenario Planning?
Stripe provides detailed information about the recurring revenue engine.
QuickBooks provides the broader financial picture.
Stripe can contribute assumptions around:
- Subscribers
- MRR
- Churn
- Expansion
- Contraction
- Pricing
- Subscription growth
QuickBooks can contribute information around:
- Revenue
- Payroll
- Marketing
- Operating expenses
- Profitability
- Cash flow
- Cash balances
- Assets
- Liabilities
- Debt
Together, they allow SaaS scenarios to connect operating changes with company-wide financial outcomes.
How RunSmart Helps SaaS Founders Model Financial Scenarios
RunSmart by Projection Genie combines Stripe subscription data with QuickBooks Online financial data to create a forward-looking baseline based on the company's historical performance.
Rather than requiring founders to build a financial model from scratch, RunSmart automatically analyzes historical financial data and establishes the starting financial forecast.
Founders can then create alternative scenarios and model changes to assumptions such as:
- Subscriber growth
- Churn
- Expansion
- Contraction
- Pricing
- Hiring
- Spending
- Financing
- Other financial assumptions
RunSmart recalculates the financial outlook under each scenario so founders can evaluate potential changes to:
- MRR
- Revenue
- Expenses
- Profitability
- Cash flow
- Financial health
- Cash balances
- Runway
This allows founders to compare possible business decisions against a consistent financial baseline.
Why Is Scenario Planning Better Than Maintaining Multiple Spreadsheet Models?
Spreadsheet scenario planning is possible, but it can become difficult to maintain as the number of assumptions and scenarios increases.
Founders may need to:
- Import actual data
- Update formulas
- Maintain subscription assumptions
- Update expense assumptions
- Copy models for different scenarios
- Check formula consistency
- Reconcile forecasts with accounting data
- Update scenarios as actual results change
RunSmart is designed to automate much of that underlying work by using connected QuickBooks and Stripe data as the foundation for forecasting and scenario modeling.
This lets founders focus more on the assumptions they want to test rather than maintaining the financial model itself.
What Questions Can SaaS Scenario Planning Help Answer?
Scenario planning can help founders explore questions such as:
- What happens if churn increases?
- What if subscriber growth slows?
- What if subscriber growth accelerates?
- What if we raise prices?
- What if the price increase causes more churn?
- What if expansion revenue improves?
- What if we hire five employees?
- What if we delay those hires?
- What if marketing spending increases?
- What if we reduce operating expenses?
- What if financing is delayed?
- What happens to runway under a downside scenario?
The objective is not to predict which outcome will occur.
It is to understand the potential financial consequences before decisions are made.
Frequently Asked Questions
What is SaaS scenario planning?
SaaS scenario planning models multiple possible financial futures by changing assumptions such as subscriber growth, churn, expansion, pricing, hiring, and spending.
What is a base-case scenario?
A base case represents the company's baseline or expected financial outlook based on a defined set of assumptions, often informed by historical performance.
What is a best-case scenario?
A best case models stronger performance than the baseline, such as faster subscriber growth, lower churn, greater expansion, or stronger financial efficiency.
What is a downside scenario?
A downside scenario models weaker performance or greater financial pressure, such as slower growth, higher churn, increased expenses, or delayed financing.
Is scenario planning the same as forecasting?
No. A forecast estimates future financial performance based on a set of assumptions. Scenario planning changes those assumptions to evaluate alternative possible outcomes.
What is the difference between scenario planning and sensitivity analysis?
Scenario planning typically changes multiple assumptions to represent different possible futures. Sensitivity analysis isolates how changes to a particular variable, such as churn, affect the forecast.
What SaaS metrics should be included in scenario planning?
Common variables include subscriber growth, customer churn, revenue churn, MRR, expansion, contraction, pricing, ARPA, and NRR.
Should SaaS hiring be included in scenario planning?
Yes. Hiring can materially affect expenses, profitability, cash flow, and runway and should be evaluated alongside revenue assumptions.
Can a company grow ARR while shortening its runway?
Yes. If expenses and cash burn grow faster than cash inflows, ARR can increase while runway decreases.
Why combine Stripe and QuickBooks for scenario planning?
Stripe provides detailed subscription and recurring revenue data, while QuickBooks provides broader financial information about expenses, profitability, cash flow, cash balances, assets, liabilities, and debt.
Can RunSmart create multiple SaaS financial scenarios?
Yes. RunSmart allows founders to create alternative scenarios based on different operating and financial assumptions and compare their potential impact on the company's financial outlook.
Can RunSmart model churn, pricing, hiring, and spending together?
Yes. RunSmart allows these assumptions to be incorporated into the same financial scenario so founders can see how combinations of business decisions could affect future financial performance.
SaaS Scenario Planning Turns “What If?” Into a Financial Model
SaaS founders make decisions under uncertainty.
Subscriber growth can accelerate or slow.
Churn can rise or fall.
Pricing can change.
Hiring plans can expand.
Expenses can increase.
Rather than relying on a single forecast, scenario planning allows founders to explore how different combinations of these changes could affect the business.
Combining Stripe subscription data with QuickBooks financial data connects SaaS operating assumptions to revenue, profitability, cash flow, and runway.
RunSmart brings those variables together so founders can model the financial consequences of potential decisions before committing to them.