

Automate & Scale FP&A Across Your Entire QuickBooks Client Base



Turn Month-End Close Into Client-Ready Advisory Reports
After each month-end close, RunSmart automatically transforms your clients' QuickBooks Online data into forecasts, financial health insights, risk alerts, budgets, and client-ready advisory reports. Instead of spending hours updating spreadsheets, rebuilding forecast models, reviewing financial statements, and preparing reports before every client meeting, your team starts with much of the financial analysis and report preparation already completed.
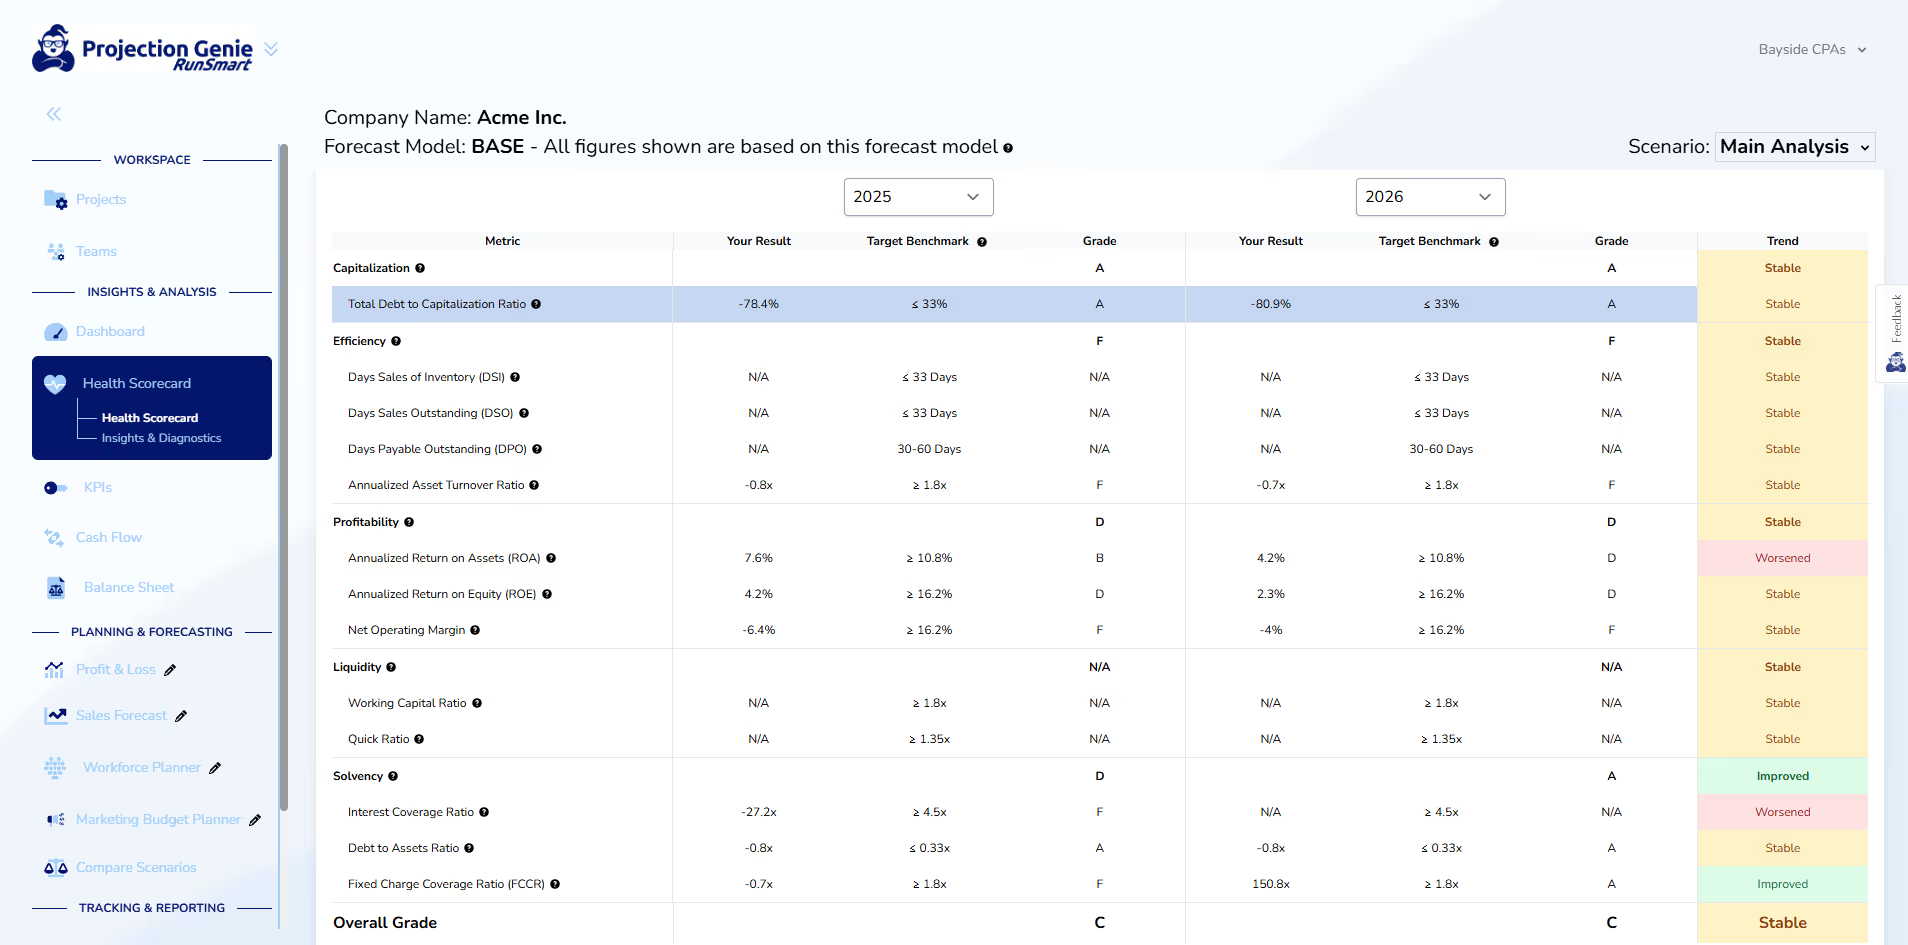
Health Assessments & Insights
Understand each client's financial health in minutes instead of manually reviewing data, calculating ratios, and comparing performance across multiple periods.

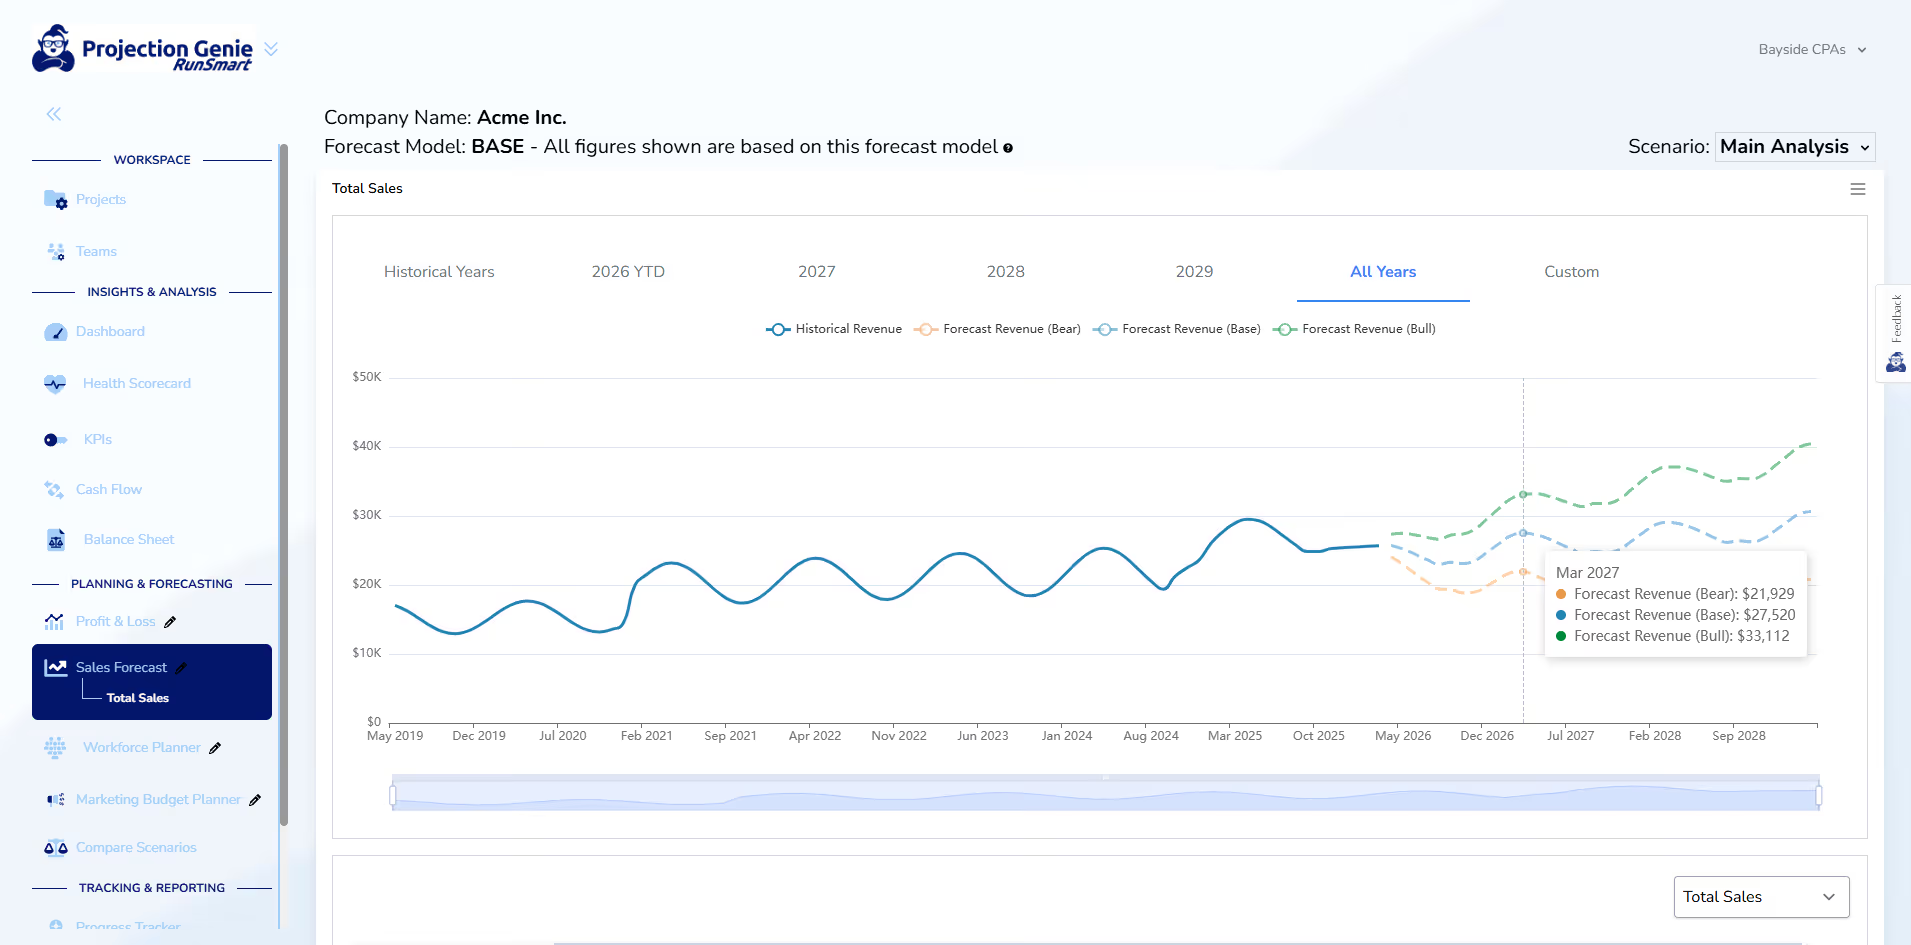
Forecasting & Planning
RunSmart automatically generates forward-looking forecasts from historical QuickBooks data using purpose-built statistical models and deterministic financial logic—not generative AI—and helps your firm model the financial impact of client decisions around hiring, spending, pricing, financing, and growth.
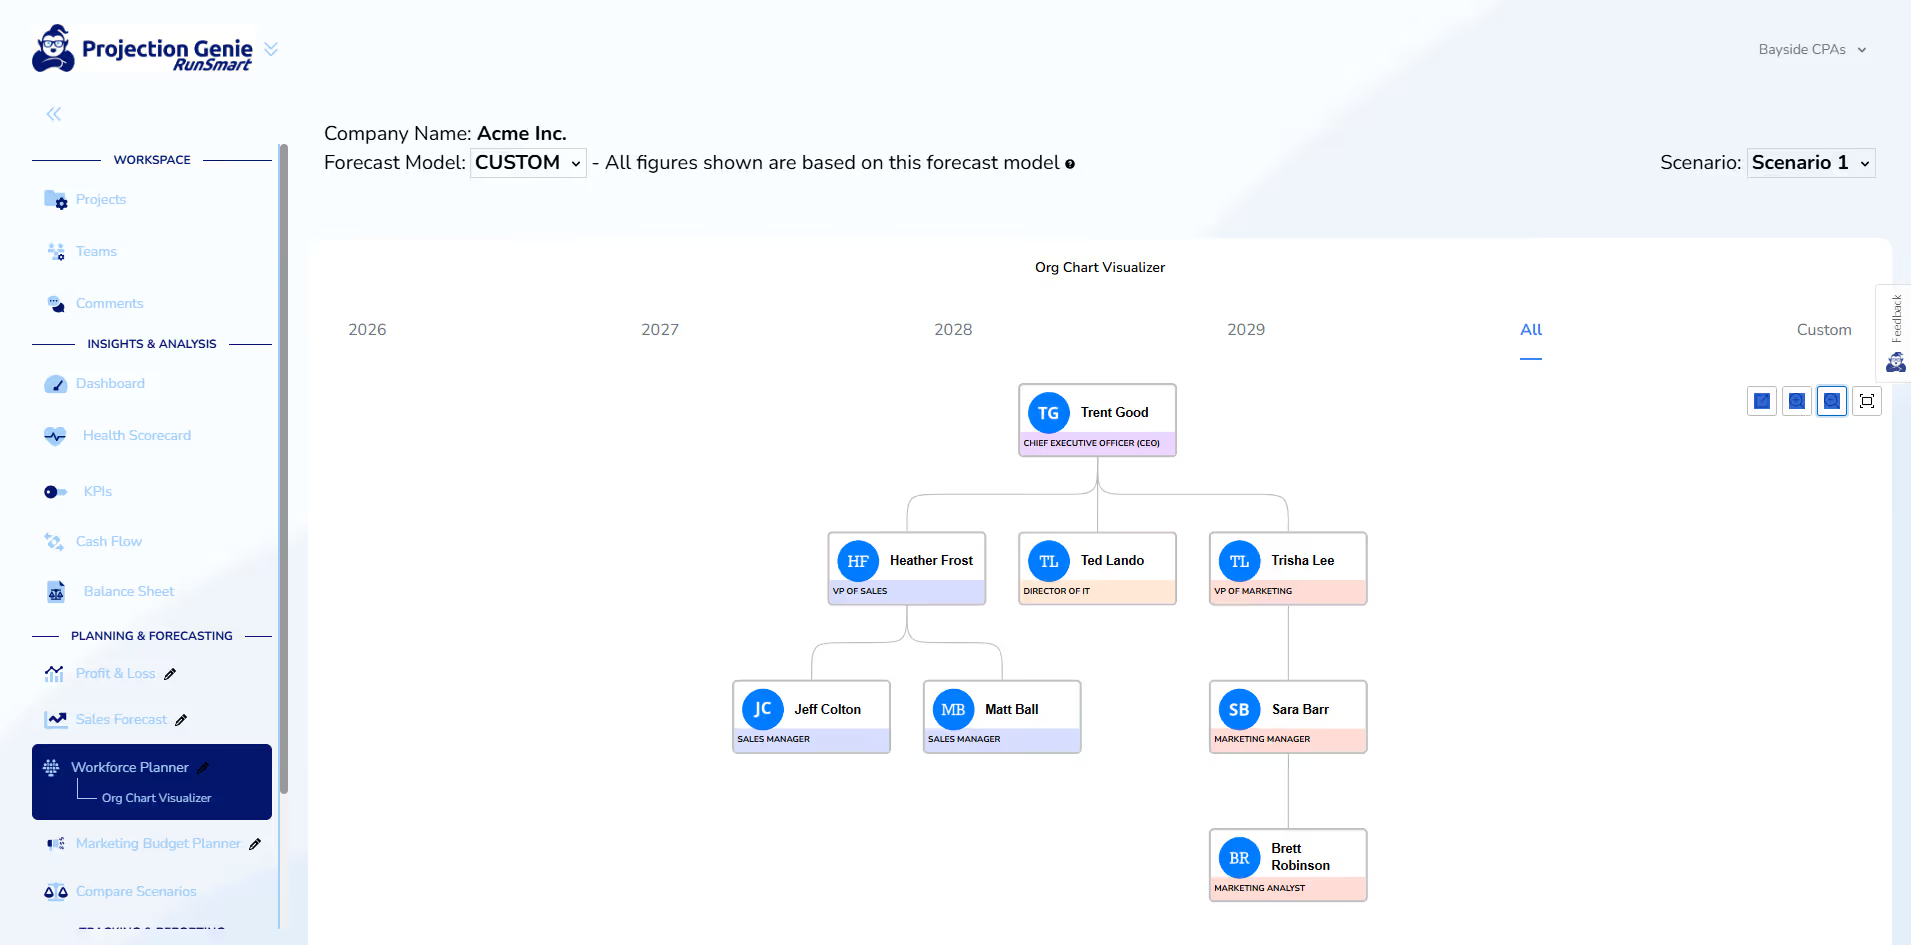
Workforce Planning
Automatically forecast how hiring, compensation changes, and workforce growth may impact payroll, cash flow, profitability, and future staffing needs so you can help clients can make more informed workforce decisions.
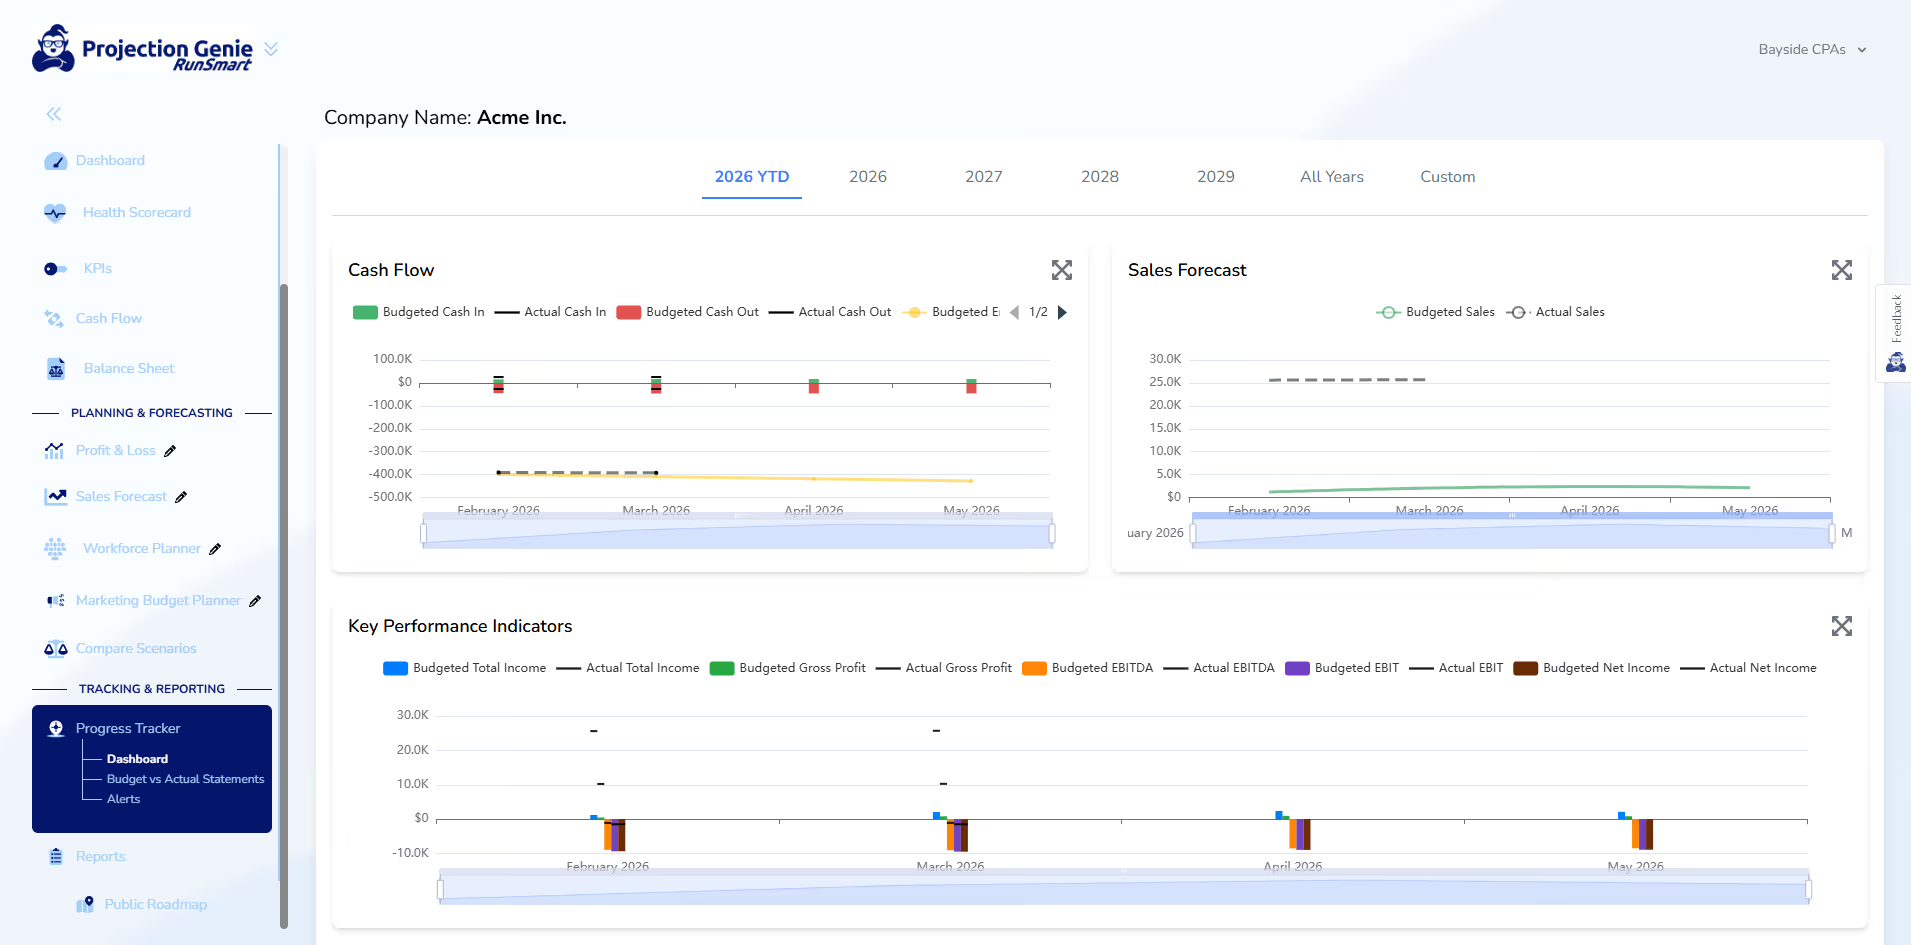
Budgeting & Progress Tracking
Turn financial forecasts into actionable budgets and automatically monitor client performance throughout the year so you can quickly identify where attention is needed.
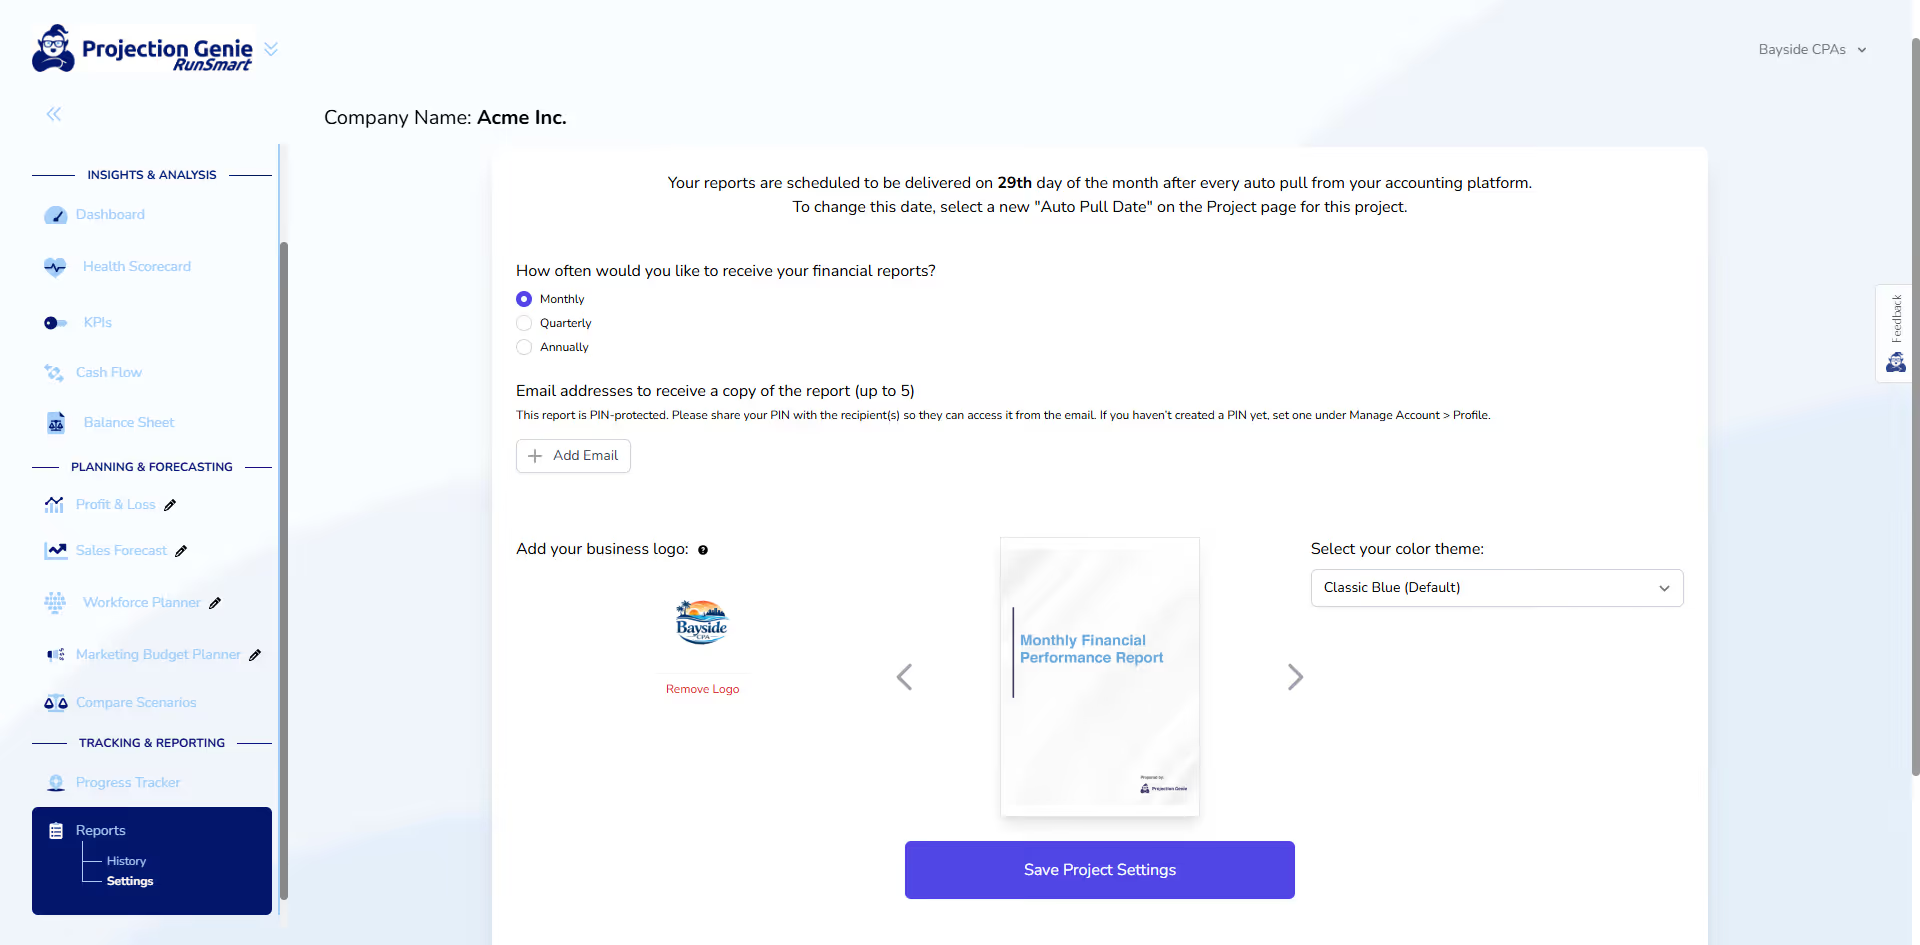
Monthly Reporting
RunSmart automatically prepares professional, client-ready advisory reports that are ready to share after each month-end close.
What Advisors Are Saying


RunSmart FAQs
Answers to common questions about how RunSmart works and what you can expect.
Many FP&A platforms are built for dedicated finance teams and require significant setup, configuration, and ongoing financial modeling. RunSmart is designed to give business owners powerful financial intelligence and planning capabilities without the complexity of traditional FP&A software.
Simply connect your QuickBooks account and RunSmart automatically analyzes your financial performance, generates forecasts and insights, monitors your financial health, tracks budgets, and produces professional reports without requiring you to build or maintain complicated financial models.
No. RunSmart is designed to make complex financial information easier to understand, even if you don't have a background in finance or accounting.
Plain-language insights, helpful tooltips, and an extensive library of help articles explain financial concepts and results throughout the platform. RunSmart also includes an AI-powered chatbot that can answer questions and explain unfamiliar financial concepts in simple terms whenever you need additional help.
No. RunSmart's core financial analysis and forecasting are powered by purpose-built financial algorithms, statistical models, and deterministic financial logic—not generative AI.
This means important financial calculations aren't dependent on how an AI model interprets a prompt or generates a response. Instead, RunSmart is designed to produce consistent, repeatable results grounded in a business's actual financial data.
For forecasting, RunSmart evaluates historical financial patterns and automatically selects custom statistical forecasting models suited to the underlying data. This combines automated financial analysis with the consistency and reliability needed to make informed financial decisions.
RunSmart's forecasts are built from your historical QuickBooks data using advanced statistical forecasting techniques widely used by Fortune 500 organizations. Instead of relying on simple growth assumptions or fixed percentage increases, RunSmart automatically selects and applies statistical forecasting models tailored to your business's historical data to produce more reliable financial forecasts.
By continuously analyzing historical business performance, RunSmart generates rolling financial forecasts that help you evaluate hiring, pricing, borrowing, spending, expansion, and other important business decisions with greater confidence.
Standard and Premium plan users can begin using RunSmart with less than 24 consecutive months of QuickBooks history. While financial forecasting will not be available until 24 months of historical data are available, you can still analyze your historical financial performance, monitor your business's financial health, review key financial metrics, compare your performance against industry benchmarks, and generate professional reports.
Once your business reaches 24 consecutive months of historical QuickBooks data, financial forecasting is automatically enabled. This allows RunSmart's statistical forecasting models to identify longer-term trends and seasonal patterns, helping produce more reliable forecasts.
Pro plan users require at least 24 consecutive months of historical QuickBooks data before using RunSmart. The Pro plan is designed for businesses that need advanced forecasting, scenario planning, budgeting, workforce planning, automated reporting, and other forward-looking financial planning capabilities, all of which depend on sufficient historical data to produce reliable results.
No. RunSmart is intentionally designed for single-entity businesses and does not support consolidating multiple companies or budgeting by class.
RunSmart focuses on helping firms analyze each client independently so trends, risks, and performance changes are easier to detect, explain, and address.
At this time, RunSmart only supports QuickBooks Online.