Financial Intelligence Software Built for Venture Capital Firms
RunSmart automatically brings QuickBooks and Stripe data together across your portfolio, continuously analyzing financial health, forecasts, emerging risks, runway, and capital needs without requiring portfolio companies to prepare or maintain separate reporting models. -MCP capabilities coming soon-
Why Venture Capital Firms Choose RunSmart
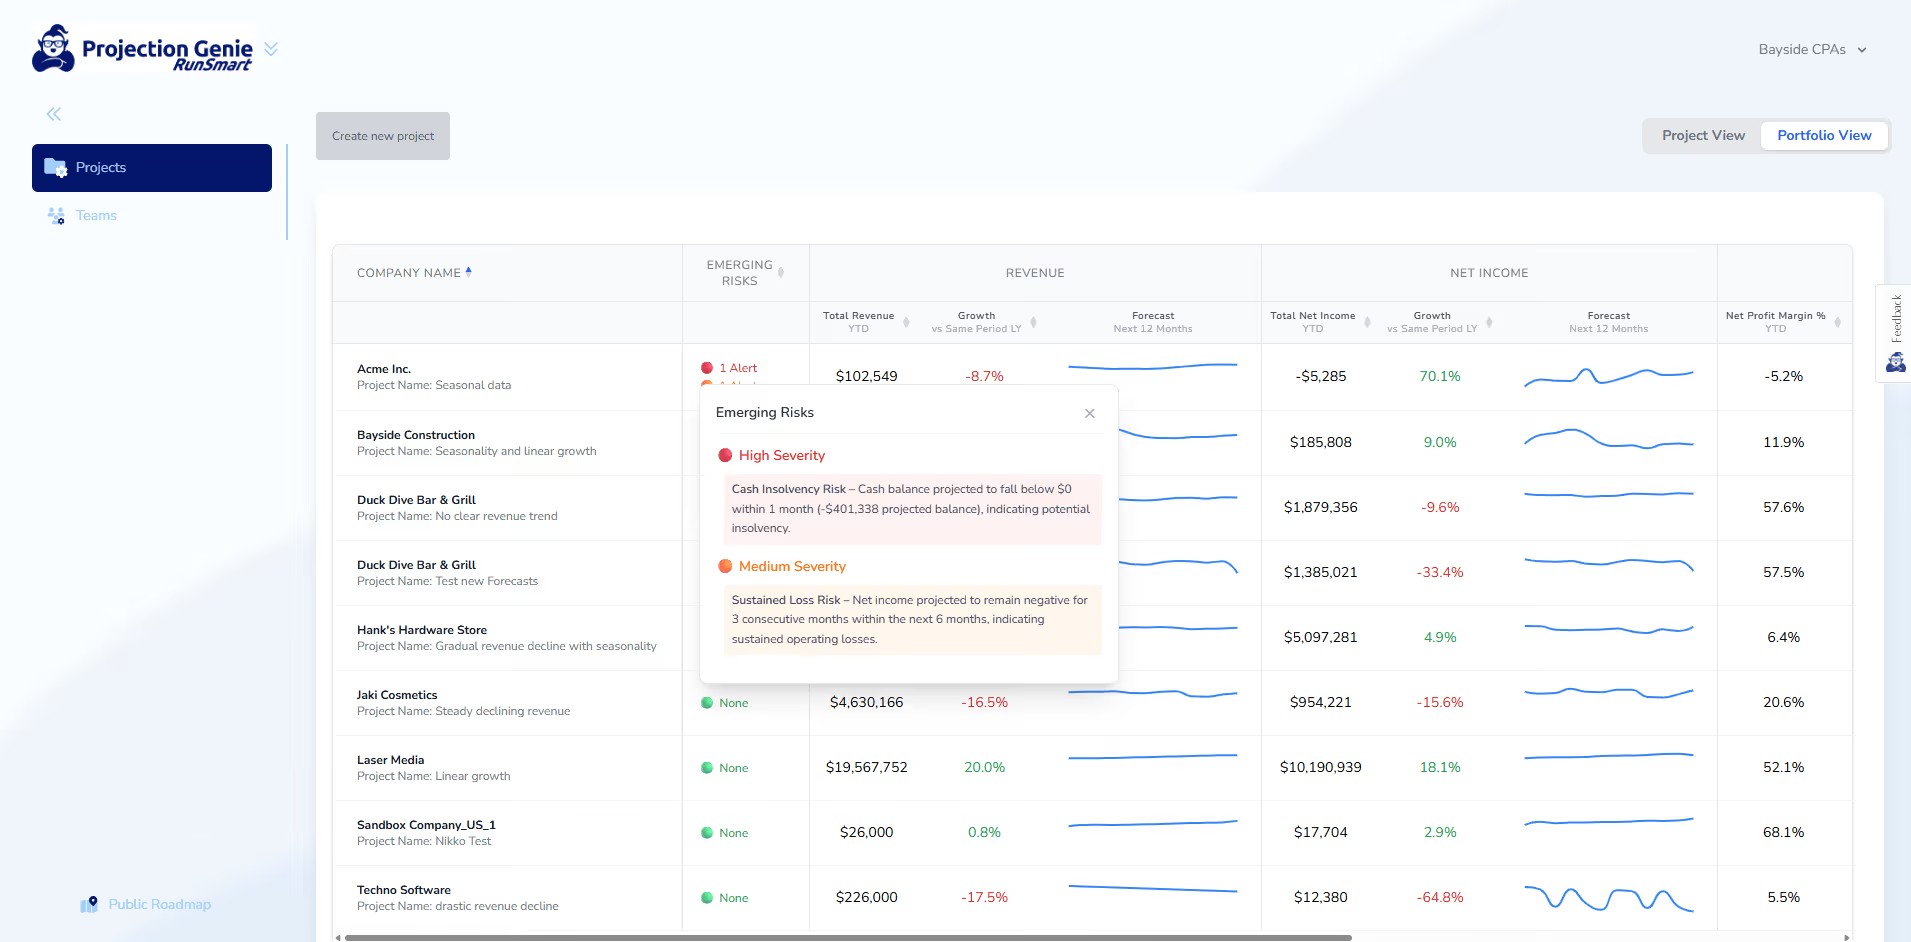
See Portfolio Risk Across Companies
Monitoring a portfolio often means relying on financial updates prepared differently by every company, making it difficult to compare performance and identify emerging concerns consistently.
RunSmart automatically standardizes financial forecasting and business health analysis across your portfolio, so your team can compare companies consistently without manually collecting, normalizing, or rebuilding financial information.
Look Beyond SaaS Metrics Alone
MRR, ARR, churn, retention, and customer growth are important, but they only explain part of a SaaS company’s financial position.
RunSmart combines subscription activity from Stripe with accounting data from QuickBooks so your team can understand how revenue performance connects to expenses, profitability, cash flow, runway, liquidity, and overall financial health.
Understand Runway and Capital Needs Earlier
Changes in hiring, growth, expenses, margins, and customer retention can materially change how long a portfolio company’s cash will last.
RunSmart forecasts future cash flow and financial performance so your team can identify potential runway pressure, funding needs, and financial constraints earlier instead of discovering them during the next board meeting or fundraising process.
Focus Attention Where It Matters Most
Not every portfolio company requires the same level of attention at the same time.
RunSmart automatically monitors the portfolio for emerging financial risks and changing trends, helping your team identify which companies need attention without reviewing every company individually.
Core Features Venture Capital Firms Can Leverage
Portfolio View & Cross-Company Intelligence
View portfolio companies together instead of opening individual financial models, reports, or spreadsheets one at a time.
Automatically surface and compare financial health, forecasted performance, emerging risks, and important trends across companies, eliminating the need to manually review each portfolio company just to determine where your team should focus.
Use RunSmart’s MCP capabilities to ask questions across your portfolio, such as which companies face the greatest financial risk over the next 12 months, which may need additional capital, or where margins are projected to tighten.
Automated Forecasting & Rolling Projections
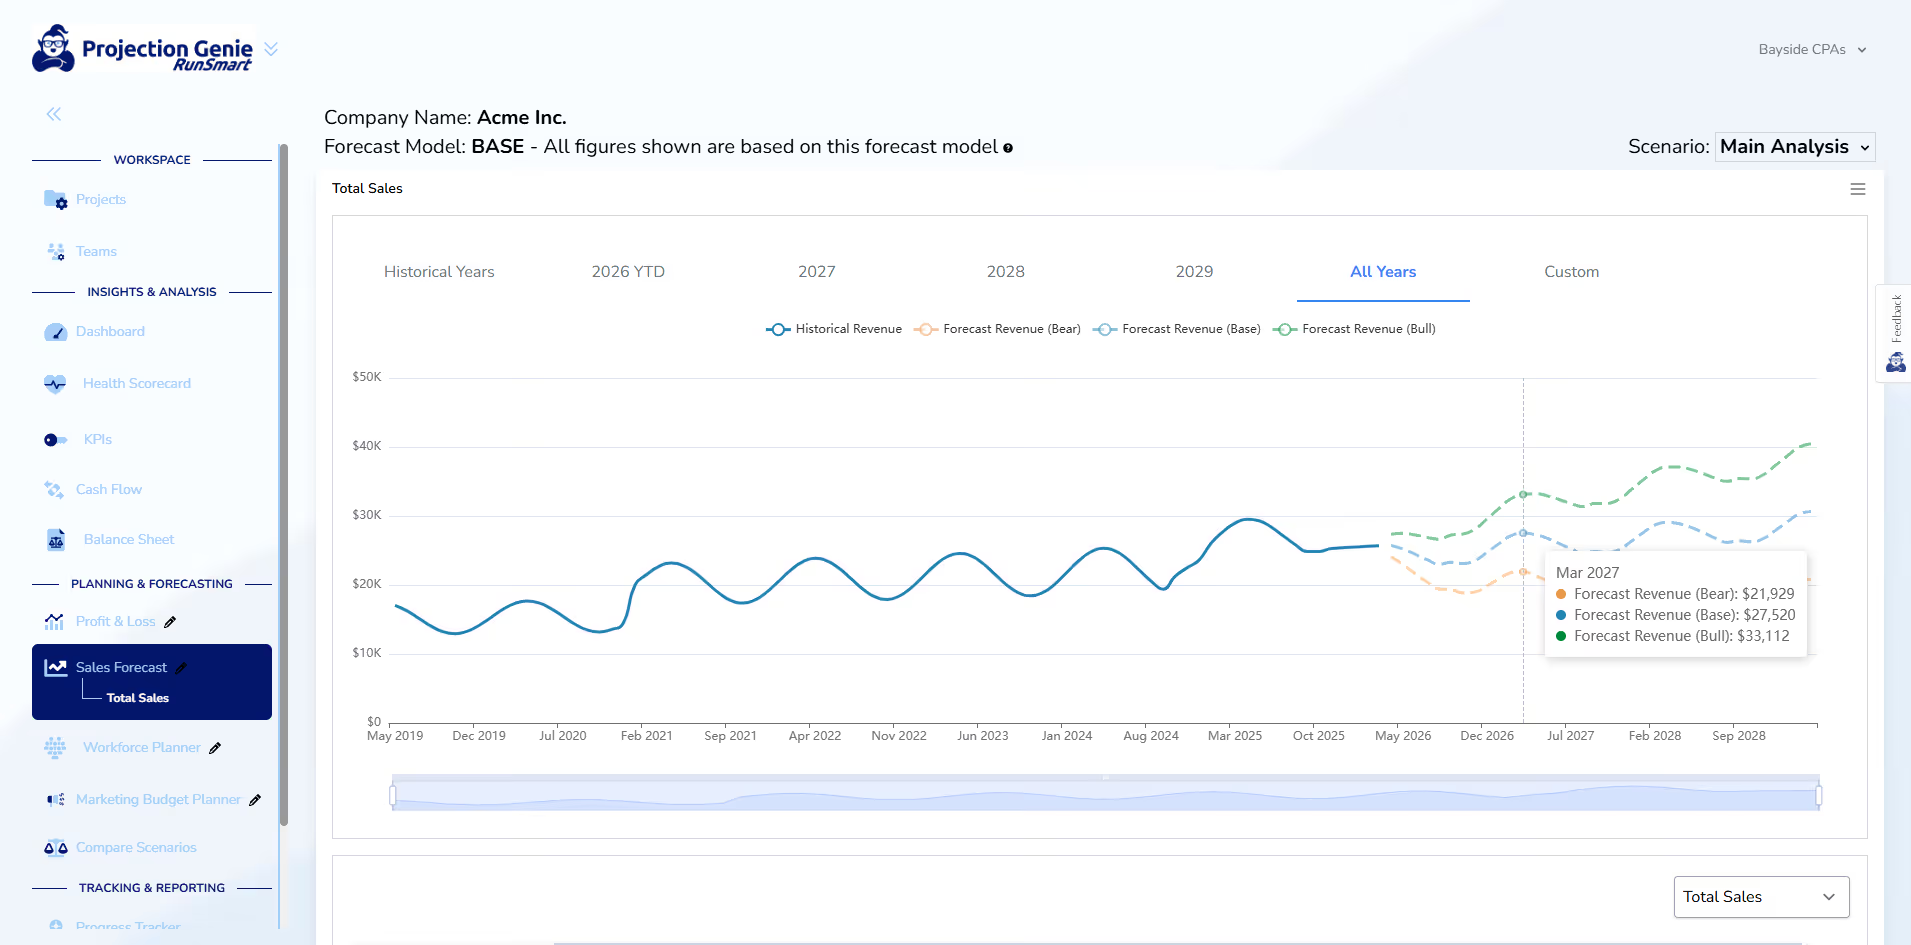
RunSmart automatically pulls updated financial data from QuickBooks Online and Stripe and generates rolling forecasts as each portfolio company’s performance changes.
See how recent revenue, expenses, margins, customer activity, and operating performance may affect future cash flow, profitability, runway, and financial health.
RunSmart automatically updates forecasts and financial insights as new data flows in, giving your team a continuously current, forward-looking view without requiring portfolio companies to rebuild models, update spreadsheets, or prepare reports manually.
Scenario & What-if Modeling
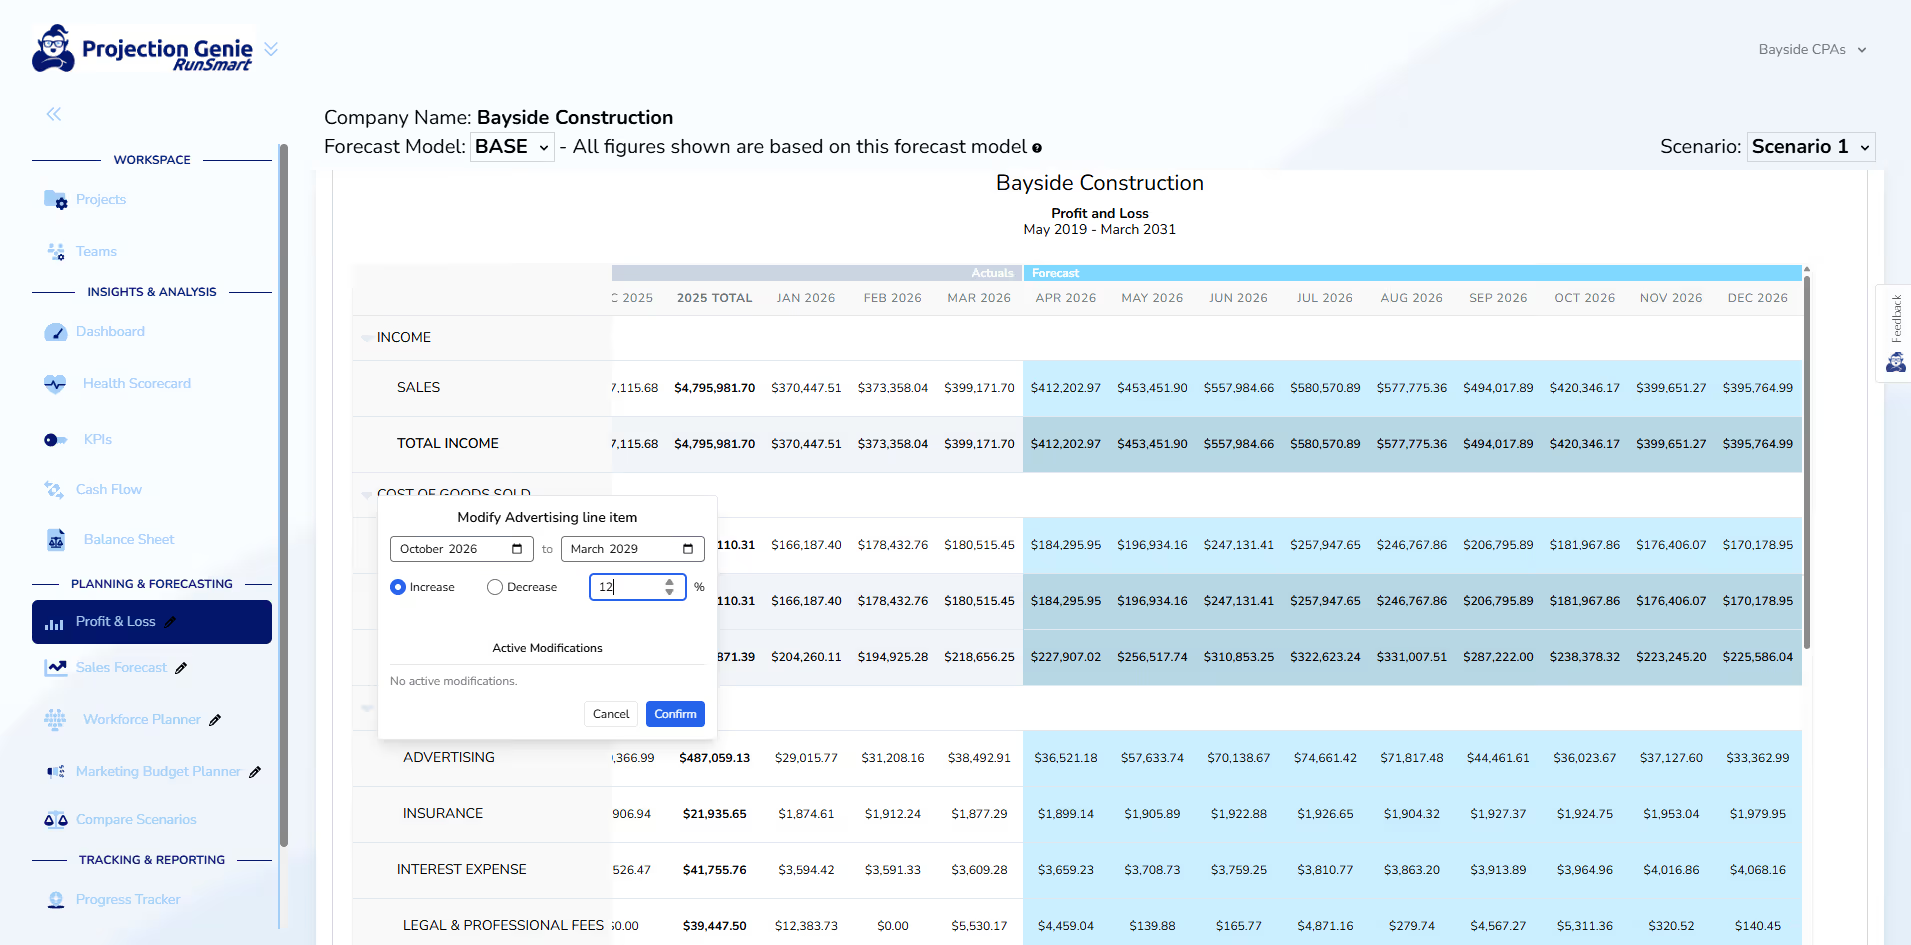
Evaluate how different assumptions could change a portfolio company’s financial outlook, including hiring plans, pricing changes, subscriber growth, churn, spending changes, product launches, and additional capital.
Compare scenarios to understand how different operating decisions may affect future revenue, cash flow, profitability, runway, and long-term financial health.
Use scenario analysis to make investor and founder conversations more specific by connecting potential decisions directly to their projected financial impact.
SaaS Revenue & Growth Analysis
Understand how subscriber growth, churn, expansion, contraction, pricing, and product changes may influence the future performance of SaaS portfolio companies.
Analyze subscription trends alongside the broader financial statements instead of evaluating SaaS metrics separately from expenses, cash flow, and profitability.
See whether revenue growth is translating into stronger financial performance or whether rising costs, weakening margins, or other factors may be offsetting that growth.
Financial Health Indicators & Early Risk Signals
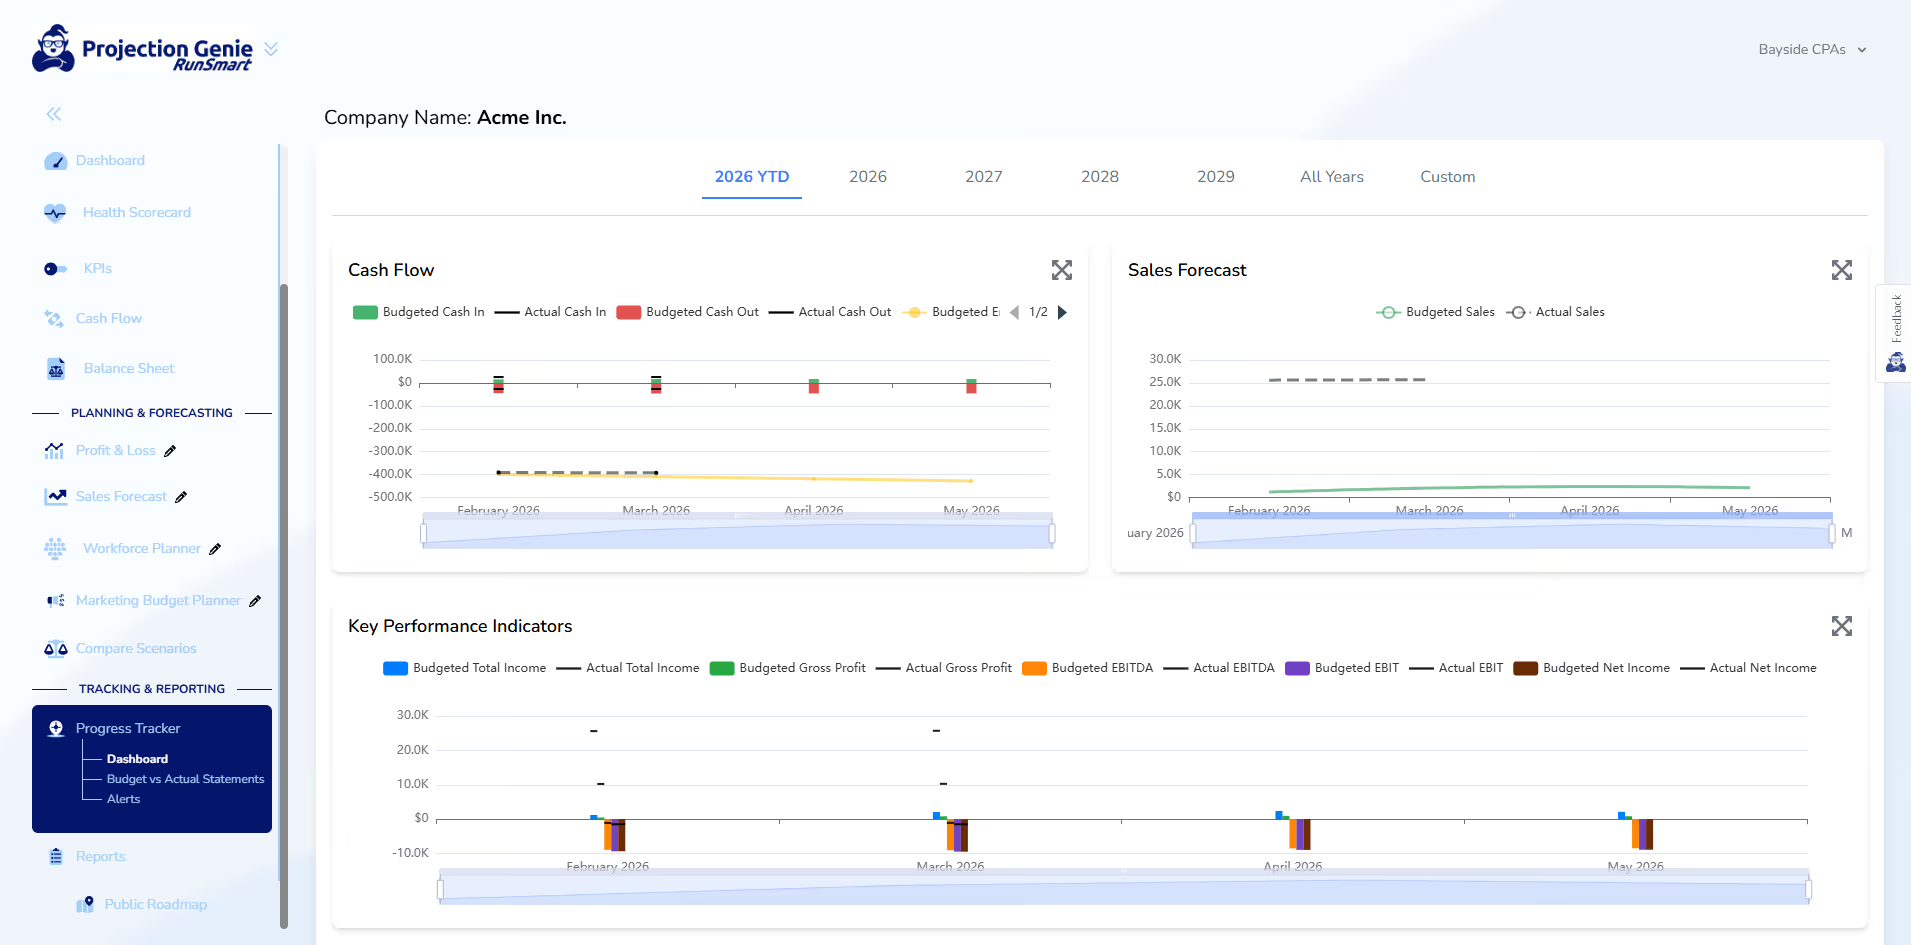
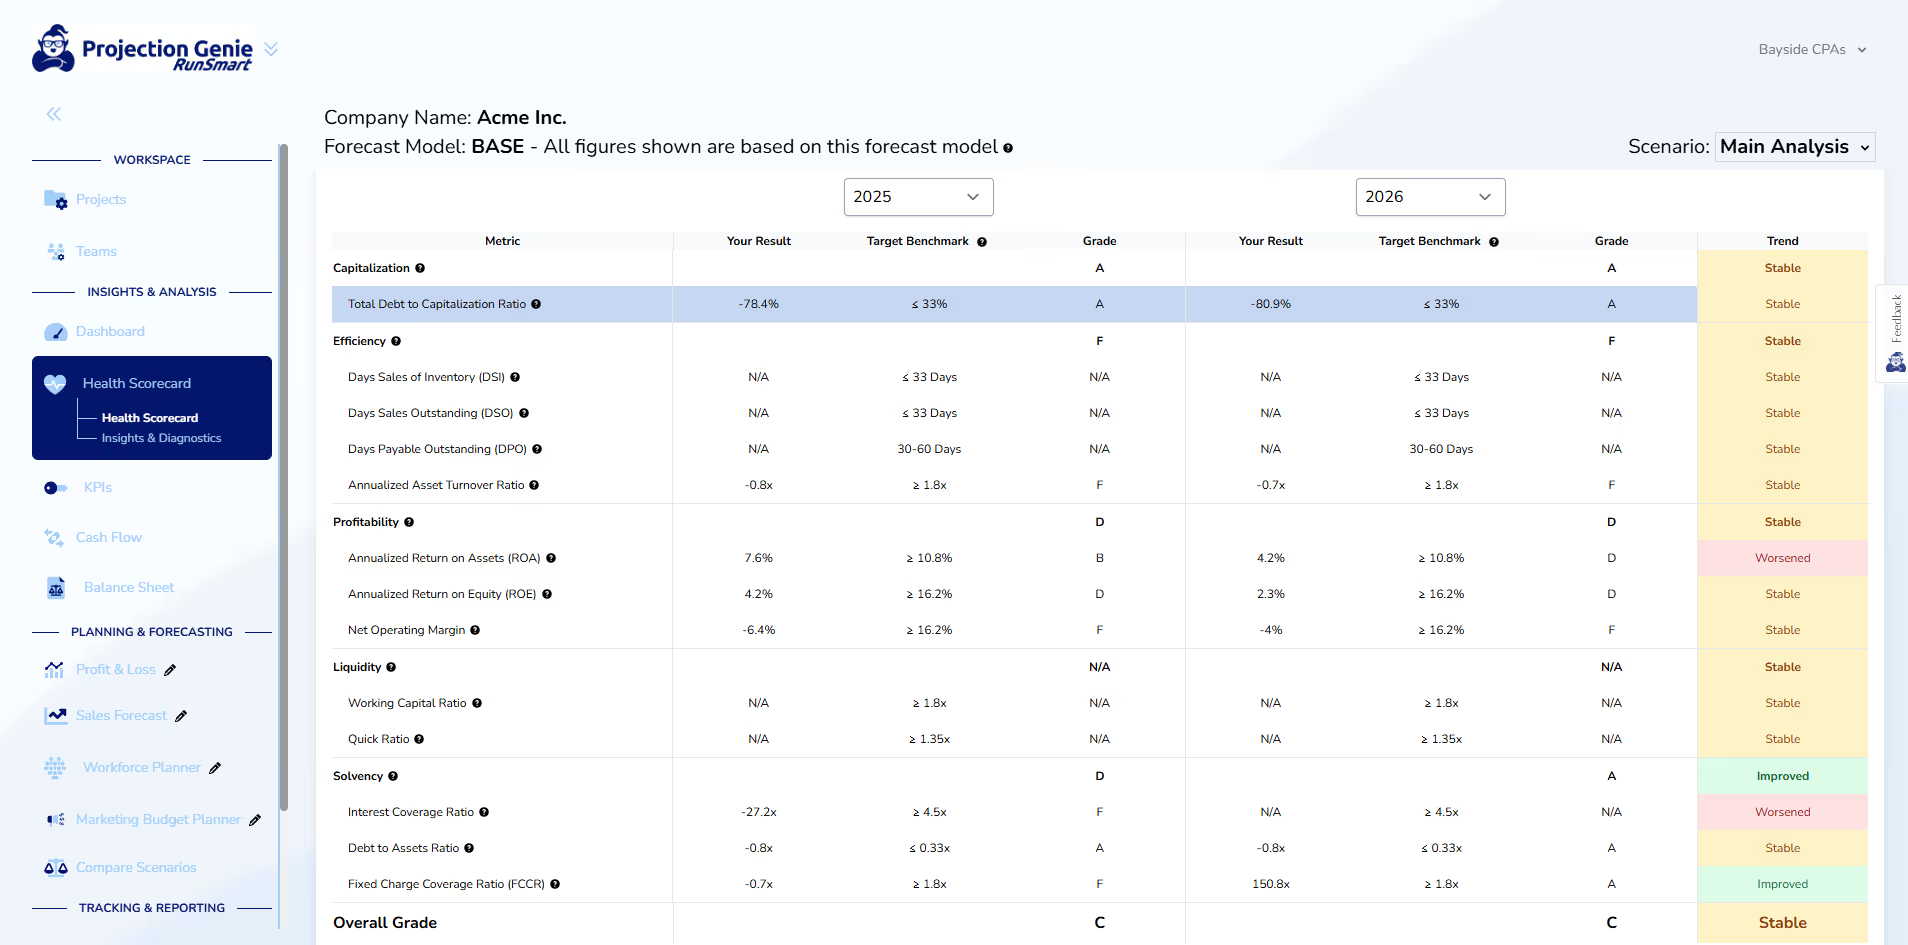
RunSmart automatically monitors key areas of business health, including profitability, liquidity, solvency, efficiency, and capitalization, and surfaces changes that may require investor attention.
Instead of waiting for portfolio companies to report a problem or manually reviewing financial statements for warning signs, investors can see where forecasted performance may be creating future cash flow concerns, profitability pressure, or financial risk.
Use these signals to start conversations with portfolio companies earlier, while management may still have more options available to respond.
Flexible Reporting Through MCP
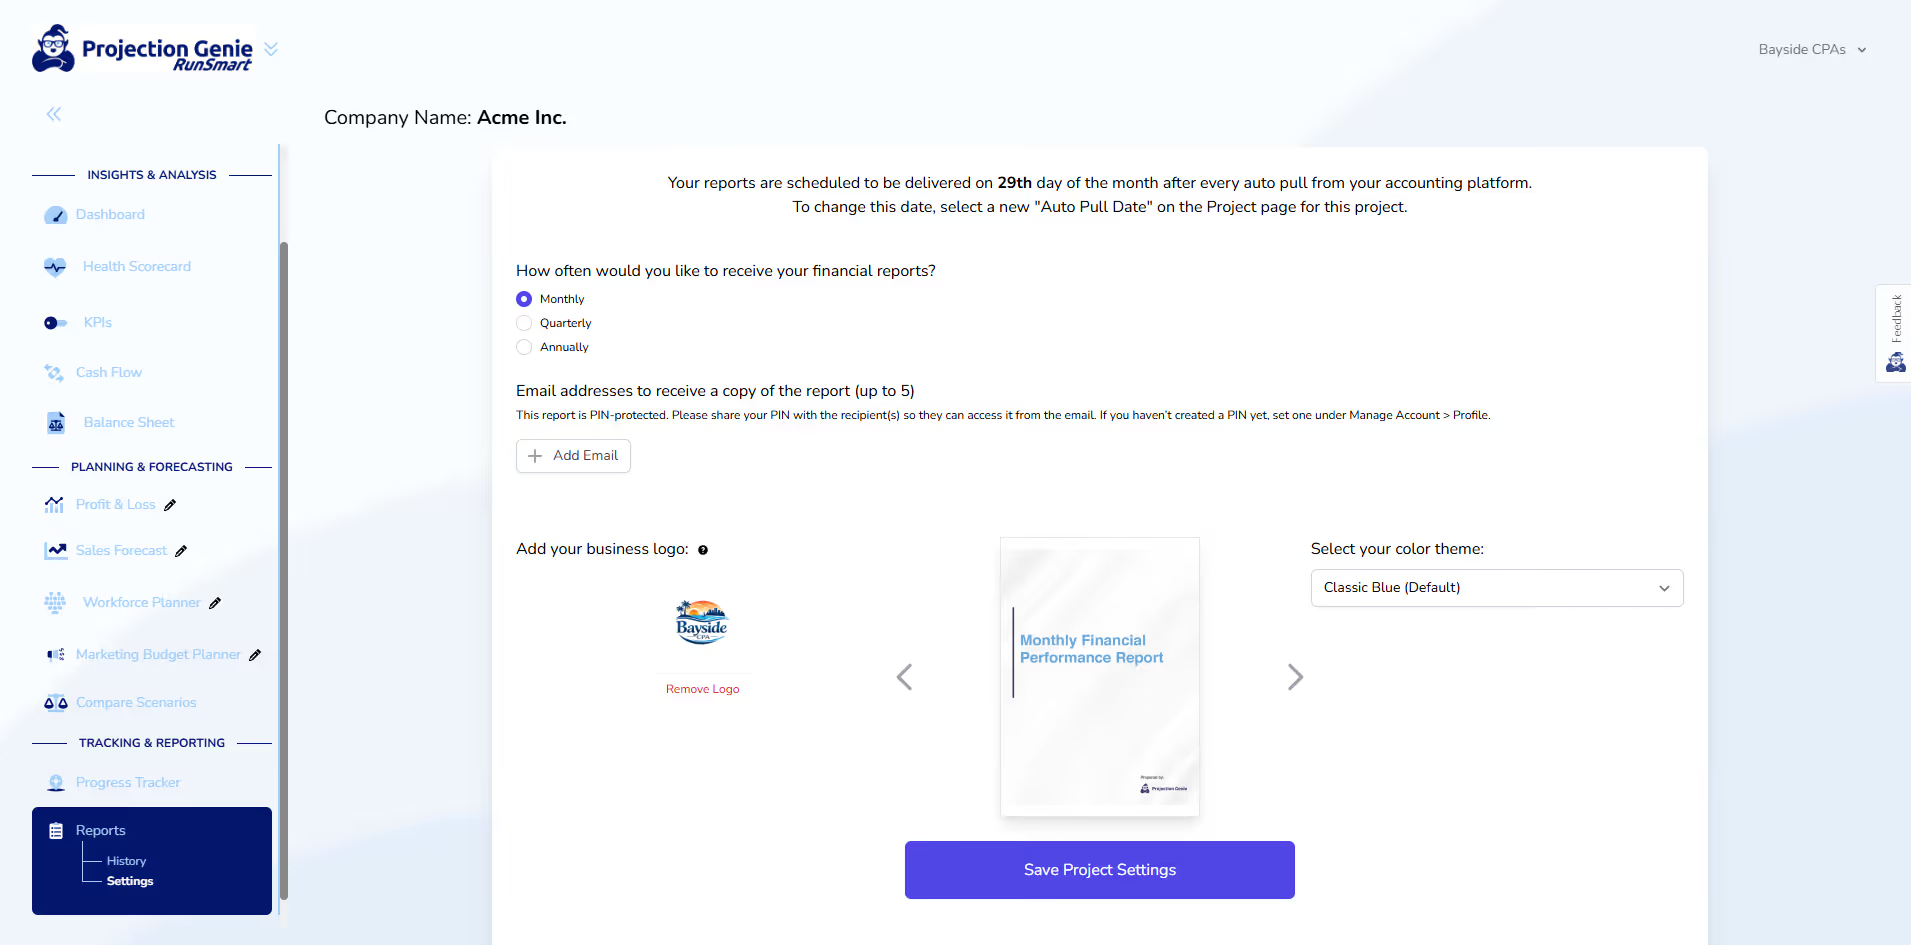
Use RunSmart’s MCP capabilities to create financial and portfolio reporting in the format and structure your firm prefers instead of being limited to a predefined investor report.
Ask your connected AI tool to analyze individual companies or your entire portfolio and turn RunSmart’s financial intelligence into the summaries, portfolio reviews, investment committee materials, partner updates, or other reporting your firm needs, without manually assembling the underlying financial analysis.
Create consistent portfolio reports across multiple companies while still tailoring the analysis, metrics, time periods, and level of detail to the way your firm evaluates investments.
Built for Collaboration & Security
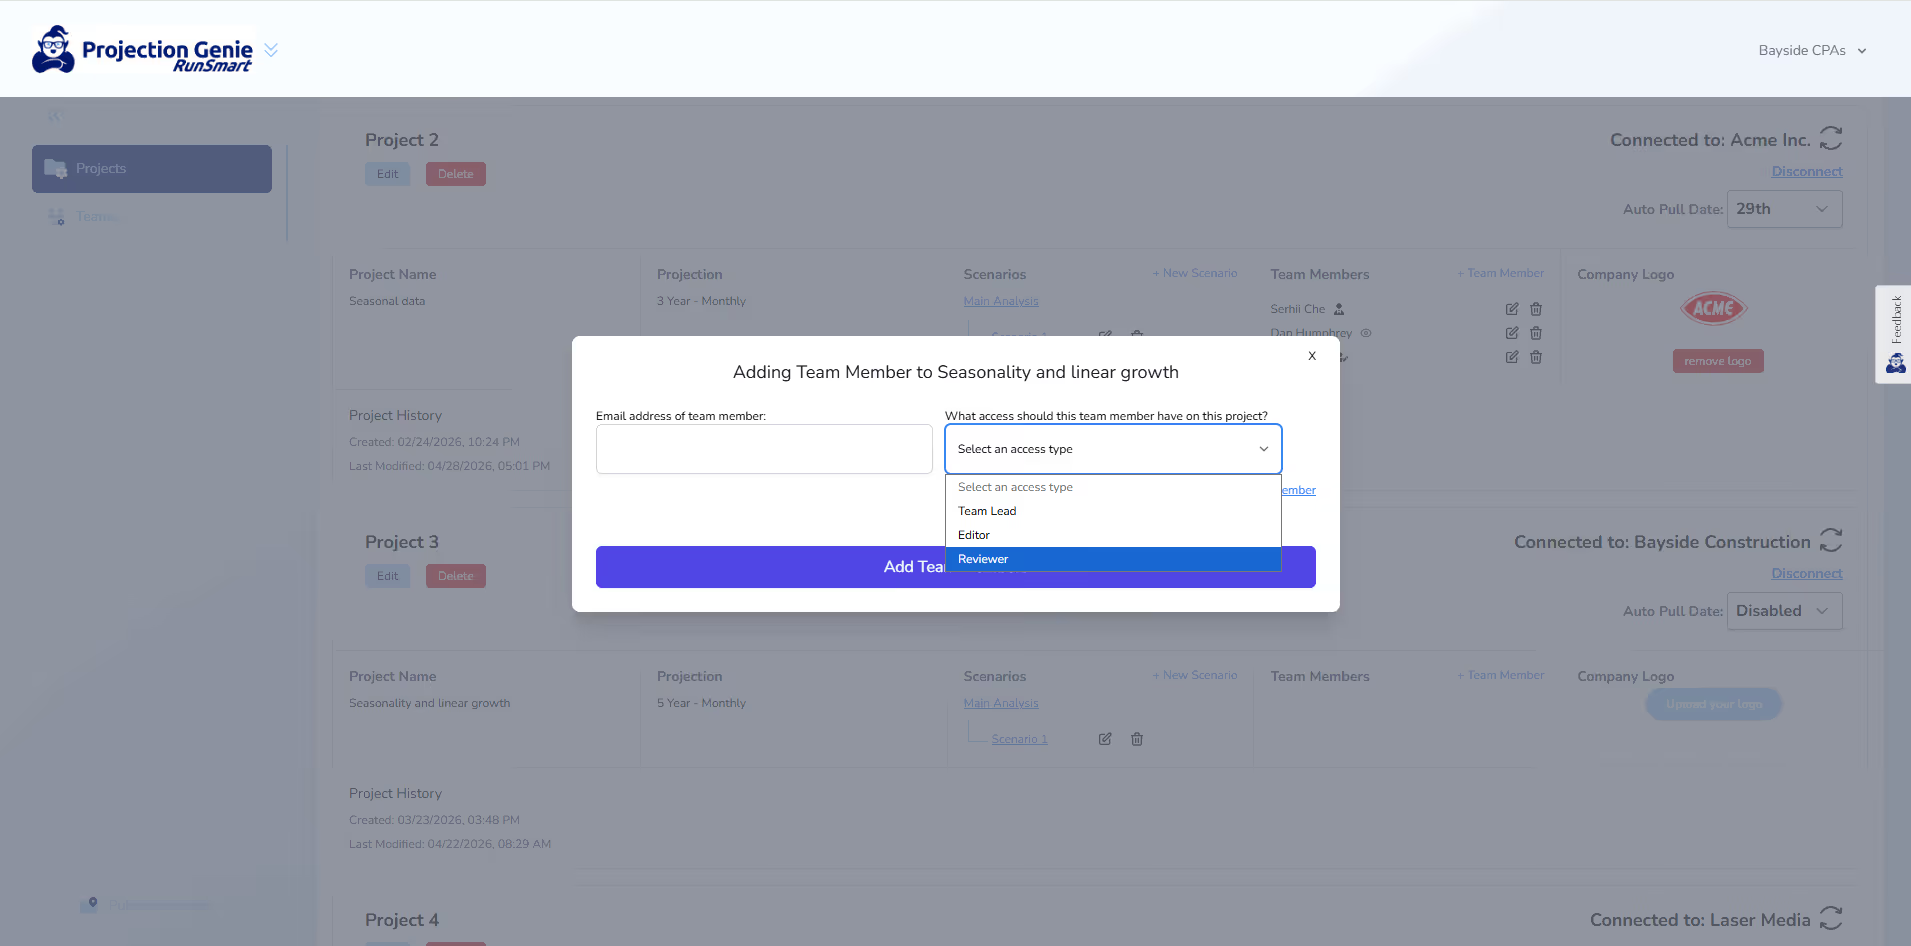
Portfolio companies can collaborate with their internal teams, accountants, bookkeepers, advisors, fractional CFOs, and other authorized users directly inside RunSmart.
Financial assumptions, forecasts, comments, and planning discussions can remain connected to the underlying numbers instead of being scattered across spreadsheets, emails, and separate reporting tools.
Projection Genie is a Silver-tier QuickBooks App Partner and has passed Intuit’s technical and security review process to help protect the financial information connected to RunSmart.
Key Benefits for Venture Capital Firms
Better Portfolio Visibility
See financial performance, forecasts, business health, and emerging risks across portfolio companies from a more consistent financial framework.
Earlier Risk Detection
Identify potential runway pressure, slowing growth, margin compression, rising expenses, sustained losses, and weakening financial health before they become urgent.
Less Manual Portfolio Analysis
Replace much of the manual work required to collect spreadsheets, normalize financial data, rebuild models, review companies individually, and assemble portfolio analysis.
Smarter Capital Decisions
Better understand which companies may require additional capital, which may have more operating flexibility, and how different assumptions could change future funding needs.
More Productive Founder Conversations
Enter board meetings, portfolio reviews, and founder conversations with a clearer understanding of where the business stands, where it may be headed, and which financial issues deserve attention.
Real Users. Real Clarity.
"What impressed me most is how easy it is. I don't have to build complex models again."
Brad Kingsford
CPA
"I can scan my entire client base and quickly spot where margins are projected to tighten without digging into each set of financials."
Ashley Chen
CPA
"I’m not building models or digging through reports anymore—it’s already laid out for me."
Brian O’Connor
CFO
"I don’t have to rebuild models just to answer basic ‘what happens if this changes’ questions."
Samantha Lee
Bookkeeper
"I save a ton of time on monthly reviews now. Most of the work is already done when I log in."
Daniel Brooks
Accounting Firm Owner
"It’s straightforward and easy to use. I didn’t have to spend time figuring things out."
Michael Patel
Small Business Owner
"Portfolio View is probably my favorite part. I can quickly see what’s going on across all my clients."
Misty Callen
Senior Advisor
"The forecasting alone is a game changer. I don't have to build or model anything manually and its so much more reliable then what I've seen from others."
Kassi Ramirez
Fractional CFO
See Your Portfolio More Clearly With RunSmart
Bring QuickBooks and Stripe data together across your portfolio, automatically forecast future performance, identify emerging financial risks, and understand which companies may need your attention most.