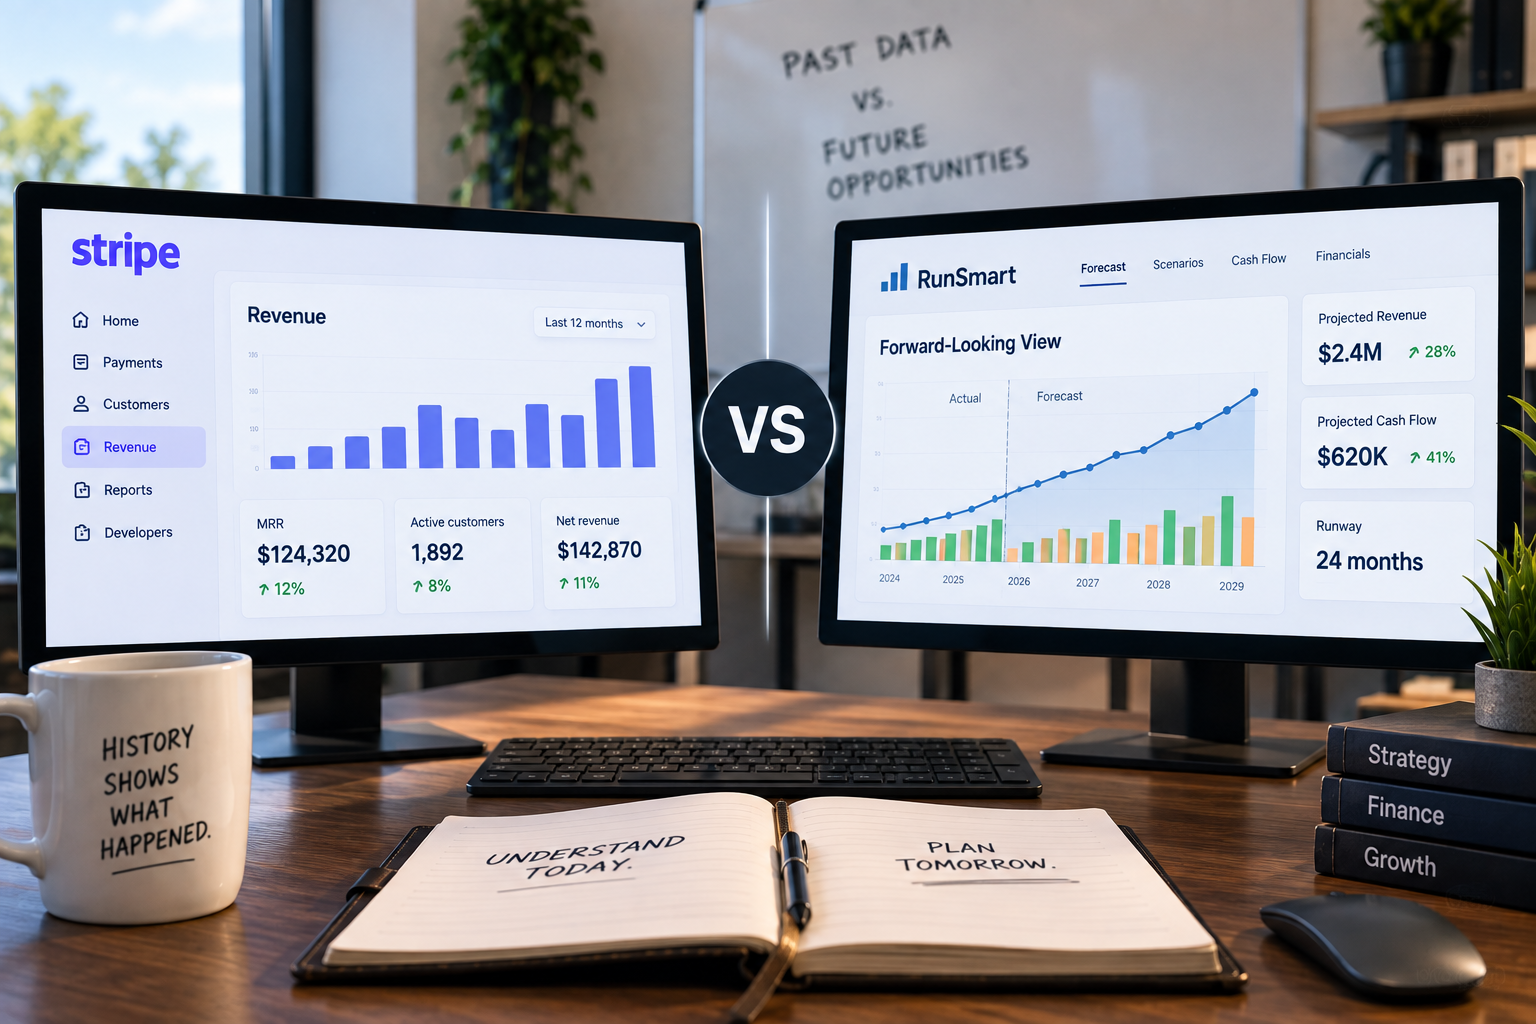
Stripe gives SaaS companies valuable visibility into their subscription businesses.
Founders can use Stripe data to understand recurring revenue, subscriptions, customers, payments, churn, and other aspects of subscription performance.
But understanding what has happened is different from forecasting what could happen next.
Stripe analytics primarily helps SaaS companies understand their subscription and billing performance. SaaS financial forecasting uses historical subscription and financial data to estimate future revenue, expenses, profitability, cash flow, and runway and to model how changes in business assumptions could affect those outcomes.
The distinction becomes important when a founder moves from asking:
“How is our SaaS business performing?”
to:
“Where is our business heading, and what happens if something changes?”
RunSmart by Projection Genie connects Stripe subscription data with QuickBooks Online financial data to bridge that gap. It uses historical business performance to establish a forward-looking financial baseline and allows SaaS founders to model changes in subscriber growth, churn, expansion, pricing, hiring, spending, financing, and other assumptions.
This guide explains the difference between Stripe analytics and SaaS financial forecasting, when each is useful, and why SaaS companies often need both.
What Is Stripe Analytics?
Stripe analytics uses payment, customer, billing, and subscription data to help businesses understand their historical and current performance.
For a SaaS company, Stripe data can provide visibility into areas such as:
- Subscription activity
- Recurring revenue
- Customers
- New subscriptions
- Cancellations
- Payments
- Pricing
- Upgrades and downgrades
- Churn
- Expansion and contraction
These metrics help founders understand how the subscription engine is performing.
For example, Stripe data may help answer:
- How much recurring revenue do we have?
- How has MRR changed?
- How many subscribers do we have?
- How many customers canceled?
- How much recurring revenue was lost?
- Are existing customers expanding their spending?
- Which subscription plans are customers purchasing?
These are important questions.
But they primarily describe the performance of the subscription business.
What Is SaaS Financial Forecasting?
SaaS financial forecasting estimates how a company's financial performance and position could change over future periods.
A financial forecast may include:
- Subscribers
- MRR
- ARR
- Revenue
- Cost of goods sold
- Operating expenses
- Payroll
- Operating profit
- Cash flow
- Assets
- Liabilities
- Debt
- Cash balances
- Financial health
- Runway
A SaaS financial forecast can use historical subscription data from Stripe as an important input, but it also needs the broader financial information required to understand the rest of the business.
That is where accounting data from a system such as QuickBooks Online becomes important.
What Is the Difference Between Stripe Analytics and SaaS Financial Forecasting?
The simplest distinction is:
Stripe analytics explains the subscription business. Financial forecasting estimates where the entire business may be heading.
The two capabilities are complementary rather than interchangeable.
Historical subscription analytics provides evidence about how the business has behaved.
Financial forecasting uses that evidence, along with broader financial data, to estimate what may happen next.
Is Stripe Analytics the Same as Financial Forecasting?
No.
Stripe data can be an important input into a SaaS financial forecast, but subscription analytics and financial forecasting serve different purposes.
Suppose a SaaS company has:
- $100,000 MRR
- 5% monthly subscriber growth
- 3% monthly churn
- 2% monthly expansion
Those metrics provide useful information about the company's recurring revenue engine.
But they do not, by themselves, answer questions such as:
- Will the company be profitable in 12 months?
- How much cash will it have?
- Can it afford to hire five employees?
- How would a new loan affect cash flow?
- How much runway does it have?
- What happens if marketing spending increases?
- How would higher churn affect future cash balances?
Those questions require a broader financial model.
What Can Stripe Data Tell a SaaS Founder?
Stripe data can help founders understand the operating mechanics behind recurring revenue.
A SaaS company may use Stripe data to analyze:
Subscriber Growth
How quickly is the customer base growing?
Churn
How many customers or how much recurring revenue is being lost?
Expansion
How much additional recurring revenue is being generated by existing customers?
Contraction
How much recurring revenue is being lost when customers downgrade or reduce spending?
Pricing
What are customers paying for subscriptions?
MRR and ARR
How large is the recurring revenue base?
These metrics can provide a detailed picture of how the subscription business is behaving.
What Can't Subscription Analytics Tell You by Itself?
Subscription analytics does not provide the entire financial picture of a SaaS company.
A company also has:
- Payroll
- Marketing expenses
- Hosting costs
- Software expenses
- Professional services
- Debt
- Interest
- Assets
- Liabilities
- Taxes
- Other operating expenses
- Cash balances
These factors determine whether recurring revenue growth translates into profitability and sustainable cash flow.
For example, two SaaS companies could both have $1 million ARR and 20% annual recurring revenue growth.
Company A could be profitable and generating cash.
Company B could be losing $100,000 per month.
ARR alone would not reveal that difference.
Why Isn't MRR Growth Enough to Understand Financial Health?
MRR growth measures the growth of recurring subscription revenue.
It does not measure what it costs to generate that growth.
Suppose a SaaS company increases MRR from $100,000 to $120,000.
That is:
$20,000 of additional MRR
But suppose monthly operating expenses increase from $110,000 to $145,000 during the same period.
Before the growth:
$100,000 revenue - $110,000 expenses = -$10,000
After the growth:
$120,000 revenue - $145,000 expenses = -$25,000
Recurring revenue increased by 20%, but the simplified operating loss increased from $10,000 to $25,000.
Growth does not automatically mean improving financial health.
Why Combine Stripe and QuickBooks for SaaS Financial Forecasting?
Stripe and QuickBooks contain different but complementary information.
Stripe helps explain the subscription engine.
QuickBooks helps explain the broader financial business.
Combining the two creates a stronger foundation for financial forecasting because changes in subscription performance can be evaluated alongside the expenses, assets, liabilities, debt, and cash flows of the company.
How Does Stripe Data Become a Financial Forecast?
Historical Stripe data can provide the operating drivers behind recurring revenue.
For example, historical performance might indicate:
- 5% monthly subscriber growth
- 3% monthly churn
- 2% monthly expansion
- 1% monthly contraction
These patterns can help establish a baseline recurring revenue forecast.
A simplified MRR calculation is:
Ending MRR = Beginning MRR + New MRR + Expansion MRR - Contraction MRR - Churned MRR
Suppose a company begins with:
- $100,000 MRR
- $8,000 new MRR
- $3,000 expansion MRR
- $1,000 contraction MRR
- $4,000 churned MRR
Projected ending MRR would be:
$100,000 + $8,000 + $3,000 - $1,000 - $4,000 = $106,000
That is a recurring revenue forecast.
But a complete financial forecast goes further.
The projected revenue needs to interact with the rest of the company's financial activity.
How Does QuickBooks Data Expand a Stripe Revenue Forecast?
QuickBooks provides historical financial information that can be used to forecast areas beyond subscriptions.
For example:
- Payroll
- Marketing
- Hosting
- Software
- Rent
- Professional services
- Interest expense
- Debt
- Assets
- Liabilities
- Cash flow
Suppose the Stripe-driven revenue forecast projects $150,000 of future monthly revenue.
If projected monthly operating expenses are $130,000, the company may generate an operating profit.
If projected expenses are $180,000, the same revenue trajectory may result in an operating loss.
The subscription forecast has not changed.
The broader financial outcome has.
This is why recurring revenue forecasting and financial forecasting are related but different.
What Is the Difference Between Reporting, Forecasting, and Scenario Modeling?
These terms are often used together, but they answer different questions.
Reporting asks: What happened?
Forecasting asks: Where might the business be heading?
Scenario modeling asks: What could happen if something changes?
A complete financial planning process can use all three.
Historical reporting provides the evidence.
Forecasting establishes the expected trajectory.
Scenario modeling allows management to test alternatives.
What Is a Baseline SaaS Financial Forecast?
A baseline forecast estimates where the business appears to be heading before management introduces additional what-if assumptions.
For example, historical Stripe data may indicate a certain pattern of subscriber growth and churn.
Historical QuickBooks data may indicate patterns in payroll, marketing, hosting, and other expenses.
Together, those patterns can establish a baseline for future revenue and financial performance.
The baseline answers:
What could happen if the business continues behaving similarly to its historical performance?
It then becomes the reference point for scenario modeling.
What Is SaaS Scenario Modeling?
Scenario modeling changes one or more assumptions to evaluate a different possible future.
A SaaS founder might model:
- Higher subscriber growth
- Lower subscriber growth
- Higher churn
- Lower churn
- More expansion revenue
- A pricing increase
- New hires
- Higher marketing spending
- New debt
- Other operating changes
For example:
The resulting scenarios can then be compared across revenue, profitability, cash flow, and runway.
Example: What Happens If SaaS Churn Increases?
Suppose a SaaS company has:
- $100,000 MRR
- 3% monthly churn
- $500,000 cash
- $130,000 monthly operating expenses
The founder wants to know what happens if churn rises to 5%.
Stripe analytics can help identify the current churn rate and historical subscription behavior.
A financial scenario can go further by changing the churn assumption and recalculating the future revenue trajectory.
If higher churn reduces projected revenue while expenses remain similar, the company could experience:
- Lower MRR
- Lower revenue
- Lower profitability
- Weaker cash flow
- Lower future cash balances
- Shorter runway
The question has moved from measuring churn to understanding its potential financial consequences.
Example: What Happens If SaaS Pricing Changes?
Suppose 1,000 customers pay an average of $100 per month.
Current MRR is:
1,000 × $100 = $100,000
If average pricing rises to $110:
1,000 × $110 = $110,000 MRR
That suggests a potential $10,000 increase in monthly recurring revenue.
But a financial scenario can also evaluate what happens if the price increase affects:
- Churn
- Customer growth
- Expansion
- Contraction
The resulting revenue forecast can then flow through projected profitability and cash flow.
This provides a more complete view than looking at the price increase in isolation.
Example: Can the Company Afford to Hire?
This is a question subscription analytics alone cannot answer.
Suppose a SaaS company wants to hire three employees at $120,000 each.
Annual salary expense:
3 × $120,000 = $360,000
Monthly salary expense:
$360,000 ÷ 12 = $30,000
Whether the company can support that additional $30,000 per month depends on more than MRR.
The founder needs to consider:
- Expected future revenue
- Existing payroll
- Other operating expenses
- Cash flow
- Available cash
- Debt obligations
- Timing of the hires
A financial forecast can incorporate those costs into future periods and show their potential impact on profitability, cash flow, and runway.
Can a SaaS Company Grow ARR and Still Run Out of Cash?
Yes.
ARR measures annualized recurring revenue.
It does not measure cash available to the company.
A SaaS company can grow ARR while also increasing:
- Payroll
- Marketing
- Product development
- Infrastructure
- Debt payments
- Other operating expenses
If cash outflows grow faster than cash inflows, the company can continue burning cash even while ARR rises.
This is one of the most important reasons SaaS founders should connect recurring revenue analytics with financial forecasting.
What Is the Difference Between ARR and Cash Flow?
ARR represents annualized recurring revenue.
Cash flow represents actual cash moving into and out of the business.
A founder therefore cannot determine cash runway simply by looking at ARR.
The company needs to understand how its recurring revenue, expenses, financing, and other cash flows interact over time.
How Does Financial Forecasting Help With SaaS Runway?
A simplified runway calculation is:
Runway = Available Cash ÷ Monthly Net Cash Burn
If a company has $600,000 in cash and burns $50,000 per month:
$600,000 ÷ $50,000 = 12 months of runway
But that assumes burn remains constant.
A forward-looking financial forecast can account for changing revenue and expenses over time.
For example:
- MRR may grow
- Churn may increase
- Employees may be hired
- Marketing spending may change
- Debt payments may begin
- Pricing may change
As those variables change, monthly cash burn can change too.
That makes a dynamic financial forecast more informative than a simple static runway calculation.
Stripe Analytics vs. Financial Forecasting: Which Does a SaaS Company Need?
In most cases, a SaaS company benefits from both.
Stripe analytics helps founders understand the subscription engine.
Financial forecasting helps founders understand where that subscription engine, combined with the rest of the business, could take the company financially.
The relationship can be summarized as:
Stripe subscription data → Recurring revenue drivers → Revenue forecast → Financial statements → Cash flow → Runway
The first part explains the mechanics of SaaS revenue.
The later stages explain the broader financial consequences.
How RunSmart Connects Stripe Analytics With SaaS Financial Forecasting
RunSmart by Projection Genie combines Stripe subscription data with QuickBooks Online financial data so SaaS founders can move from analyzing historical subscription performance to evaluating the financial future of the business.
Stripe provides information about recurring revenue drivers such as:
- Subscribers
- Growth
- Churn
- Expansion
- Contraction
- Pricing
QuickBooks provides broader financial information such as:
- Revenue
- Expenses
- Payroll
- Assets
- Liabilities
- Debt
- Cash flow
RunSmart automatically analyzes historical business performance to establish a forward-looking financial baseline.
Founders can then model changes to:
- Subscriber growth
- Churn
- Expansion revenue
- Pricing
- Hiring
- Spending
- Financing
- Other financial assumptions
RunSmart recalculates the forecast so founders can compare how those changes could affect:
- Revenue
- Profitability
- Cash flow
- Financial health
- Cash balances
- Runway
Instead of requiring the founder to manually connect SaaS metrics to a separate financial model, the subscription and accounting data become part of the same forward-looking planning process.
When Should SaaS Founders Move Beyond Historical Analytics?
Historical analytics becomes insufficient when the questions shift from measuring performance to evaluating future decisions.
For example:
Historical analytics: What was our churn last month?
Financial planning: What happens to cash flow if churn rises for the next 12 months?
Historical analytics: What is our current MRR?
Financial planning: Where could MRR be in 12 months, and can that revenue support our hiring plan?
Historical analytics: How many subscribers did we add?
Financial planning: What happens to profitability if we increase marketing spending to accelerate subscriber growth?
Historical analytics: What is our ARR?
Financial planning: How much runway could we have under our current growth and spending trajectory?
Once the question involves future financial consequences, forecasting becomes necessary.
Frequently Asked Questions
What is Stripe analytics?
Stripe analytics uses payment, customer, billing, and subscription data to help businesses understand historical and current performance, including recurring revenue and subscription activity.
Is Stripe analytics the same as SaaS financial forecasting?
No. Stripe analytics primarily helps explain subscription and billing performance. SaaS financial forecasting estimates future revenue and broader financial outcomes using subscription data together with expenses, cash flow, assets, liabilities, debt, and other financial information.
Can Stripe data be used for financial forecasting?
Yes. Stripe subscription data can provide important inputs for forecasting recurring revenue, including customer growth, churn, expansion, contraction, and pricing. A broader financial forecast also needs information about the rest of the company's finances.
Why combine Stripe with QuickBooks for SaaS forecasting?
Stripe provides detailed subscription and recurring revenue information, while QuickBooks provides broader accounting information such as expenses, assets, liabilities, debt, profitability, and cash flow. Combining them provides a more complete foundation for SaaS financial forecasting.
Can Stripe tell you how much runway a SaaS company has?
Subscription data alone is not enough to determine a complete forward-looking runway. Runway depends on available cash and future cash inflows and outflows, including expenses and other financial obligations.
Is MRR the same as cash flow?
No. MRR measures normalized monthly recurring revenue. Cash flow measures actual cash moving into and out of the company.
Is ARR the same as annual revenue?
No. ARR represents annualized recurring revenue. Accounting revenue may include non-recurring revenue and may follow different recognition timing.
Can a SaaS company grow MRR but have worsening cash flow?
Yes. MRR can grow while payroll, marketing, infrastructure, debt payments, and other expenses grow even faster, resulting in weaker cash flow.
What is the difference between SaaS forecasting and scenario modeling?
Forecasting estimates where the business may be heading based on historical performance and current assumptions. Scenario modeling changes one or more assumptions to evaluate alternative possible outcomes.
Can RunSmart forecast SaaS financial performance using Stripe and QuickBooks?
Yes. RunSmart combines Stripe subscription data with QuickBooks Online financial data to establish a forward-looking baseline and model how changes in SaaS and financial assumptions could affect future performance.
Can RunSmart model changes in churn and subscriber growth?
Yes. SaaS founders can model changes to subscriber growth, churn, expansion, and pricing and evaluate their potential impact on the broader financial forecast.
Can RunSmart show how SaaS metrics affect cash flow and runway?
Yes. Because RunSmart combines SaaS subscription data with broader QuickBooks financial data, changes in recurring revenue assumptions can be evaluated alongside projected profitability, cash flow, cash balances, financial health, and runway.
From SaaS Analytics to Forward-Looking Financial Intelligence
Stripe gives SaaS founders important visibility into how their subscription businesses are performing.
But knowing the current MRR, churn rate, subscriber count, or ARR does not automatically tell a founder where the company is heading financially.
That requires connecting the subscription engine to the rest of the business.
Stripe helps explain how recurring revenue is generated and retained.
QuickBooks helps explain the broader financial condition of the company.
RunSmart combines both to establish a forward-looking financial baseline and lets founders model how changes in growth, churn, pricing, hiring, spending, and financing could affect the company's future.
The difference ultimately comes down to two questions:
What is happening in our SaaS business?
and:
What could that mean for where our company is heading?